Updated July 28, 2023
Margin of Error Formula (Table of Contents)
- Margin of Error Formula
- Examples of Margin of Error Formula (With Excel Template)
- Margin of Error Formula Calculator
Margin of Error Formula
In statistics, we calculate the confidence interval to see where the value of the data of the sample statistic will fall. The range of values below and above the sample statistic in a confidence interval is known as the Margin of Error.
In other words, the degree of error in the sample statistic. The higher the margin of error, the lesser the confidence in the results because the degree of deviation in these results is very high. As its name suggests, the margin of error is a range of values above and below the actual results. For example, if we get a response in a survey wherein 70% of people have responded “good” and the margin of error is 5%, this means that, generally, 65% to 75% of the population think that the answer is “good”.
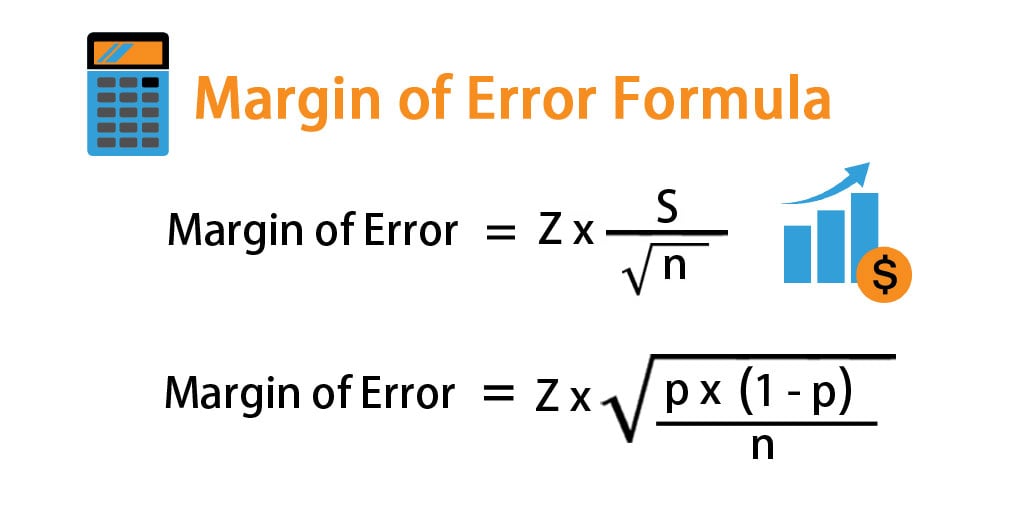
The formula for Margin of Error –
Where:
- Z – Z score
- S – Standard Deviation of a population
- n – Sample Size
Another formula for calculating the margin of error is:
Where:
- p – Sample Proportion (fraction of sample which is a success)
Now to find the desired z score, you need to know the confidence interval of the sample because the Z score depends on that. The below table is given to see the relation between a confidence interval and z score:
| Confidence Interval | Z – Score |
| 80% | 1.28 |
| 85% | 1.44 |
| 90% | 1.65 |
| 95% | 1.96 |
| 99% | 2.58 |
Once you know the confidence interval, you can use the corresponding z value and calculate the margin of error from there.
Examples of Margin of Error Formula (With Excel Template)
Let’s take an example to understand the calculation of the Margin of Error in a better manner.
Example #1
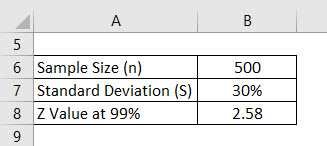
Let’s say we are conducting a survey to see what the grade score university students are getting. We selected 500 students randomly and asked for their grade scores. The average of that is 2.4 out of 4, and the standard deviation is, say, 30%. Assume the confidence interval is 99%. Calculate the margin of error.
Solution:
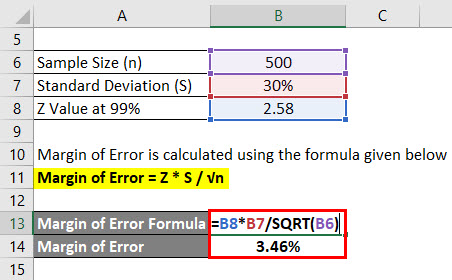
Margin of Error = Z * S / √n
- Margin of Error = 2.58 * 30% / √(500)
- Margin of Error = 3.46%
This means that with 99% confidence, the average grade of students is 2.4 plus or minus 3.46%.
Example #2
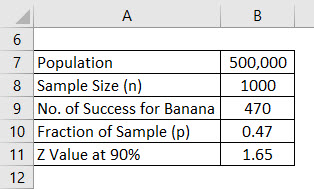
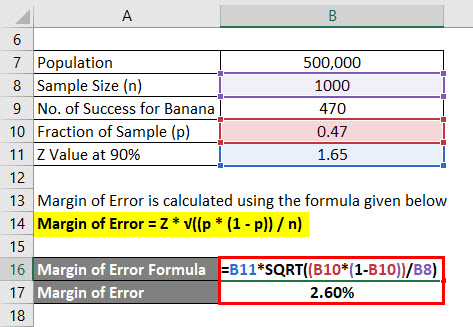
Let’s say you are launching a new health product in the market but are confused about which flavor people will like. You are confused between banana flavor and vanilla flavor and have decided to conduct a survey. Your population for that is 500,000, which is your target market, and out of that, you decided to ask the opinion of 1000 people, which will be the sample. Assume that a confidence interval is 90%. Calculate the margin of error.
Solution:
Once the survey was done, you learned that 470 people liked the banana flavor and 530 had asked for the vanilla flavor.
Margin of Error = Z * √((p * (1 – p)) / n)
- Margin of Error = 1.65 * √((0.47 * (1 – 0.47)) / 1000)
- Margin of Error = 2.60%
So we can say with 90% confidence that 47% of all people liked banana flavor plus or minus 2.60%.
Explanation
As discussed above, the margin of error helps us understand whether your survey’s sample size is appropriate. In case the margin error is too big, it can be the case that our sample size is too small, and we need to increase that so that sample results match more closely with population results.
There are some scenarios where the margin of error will not be of much use and will not help us in tracking the error:
- If the questions of the survey are not designed and do not help in getting the required answer
- If the people who are responding to the survey have some bias regarding the product for which the survey is being done, then also, the result not be very accurate
- If the sample chosen itself is the proper representative of the population, results will be way off in that case.
In the case of a small sample size and non-normal population distribution, the z-score calculation becomes impossible, and the margin of error cannot be determined.
Relevance and Uses of Margin of Error Formula
When utilizing sample data to obtain insights about a population, inherent uncertainty exists and the possibility of deviation from the actual results. The margin of error serves as a measure to indicate the extent of potential deviation in the sample findings. Minimizing the margin of error is crucial as it enables our sample results to more accurately reflect the underlying story within the population data. A lower margin of error enhances the quality of our findings. The margin of error complements and augments the statistical information, providing a more comprehensive perspective. For instance, if a survey reveals that 48% of individuals prefer spending their weekends at home, it lacks precision and leaves some elements missing. By introducing a margin of error, such as 5%, the interpretation would be that approximately 43-53% of people favored the idea of being at home during the weekend, which offers a more comprehensive understanding.
Margin of Error Formula Calculator
You can use the following Margin of Error Calculator
| Z | |
| S | |
| √n | |
| Margin of Error
| |
| Margin of Error | = |
|
|
Recommended Articles
This has been a guide to the Margin of Error formula. Here we discuss calculating the Margin of Error and practical examples. We also provide a Margin of Error calculator with a downloadable Excel template. You may also look at the following articles to learn more –

