Updated August 21, 2023
3D Maps in Excel (Table of Content)
3D Maps in Excel
3D Maps in Excel is a three-dimensional visualization tool used to map and graph a huge amount of country or region-wise arranged data. Sometimes data is so huge that we cannot apply the filter or plot regular graphs.
How to Access 3D Maps in Excel?
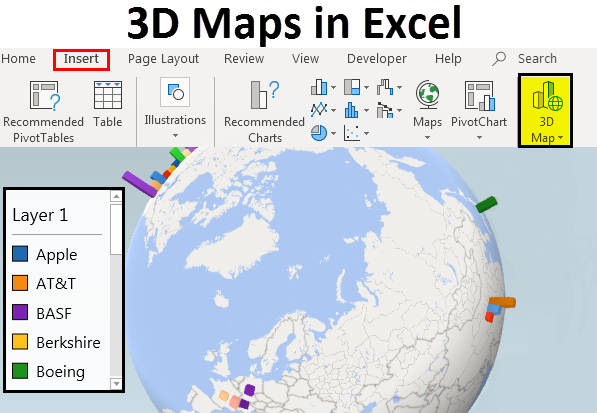
To access 3D Maps, go to the Insert menu; select or click on Maps under the Power Map section.
Steps to Download 3D Maps in Excel 2013
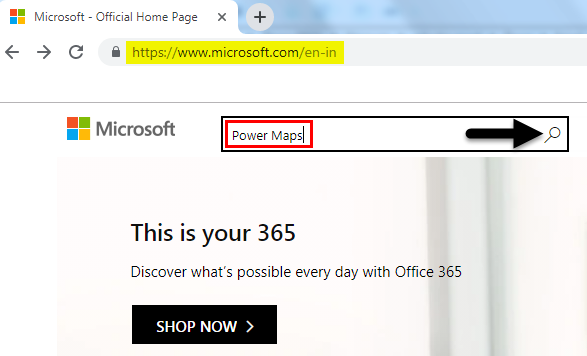
3D Maps are already inbuilt in Excel 2016. But for Excel 2013, we need to download and install packages as the add-in. This can be downloaded from the Microsoft website. For Excel 2013, 3D Maps are named Power Maps. We can directly search for this on the Microsoft website, as shown below.
Downloading Step 1
Downloading Step 2
Downloading Step 3
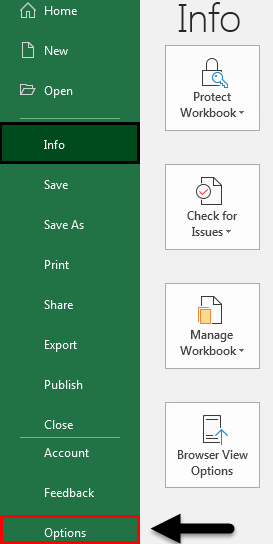
Download Power Map and Install it. Go to the File menu to implement in the Excel Menu bar.
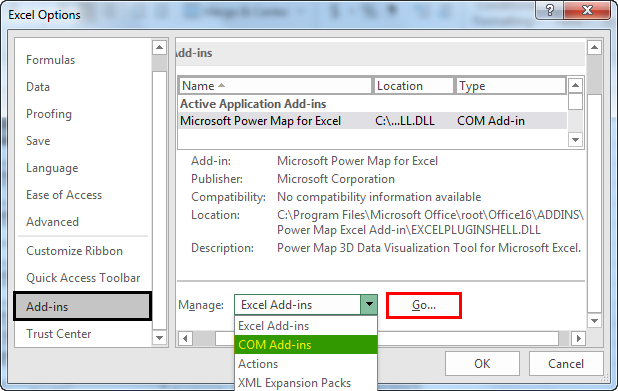
Once we click on it, we will see the Excel options window. In that, go to Add-ins, and in Manage, select COM Add-ins and click on Go as shown below screenshot.
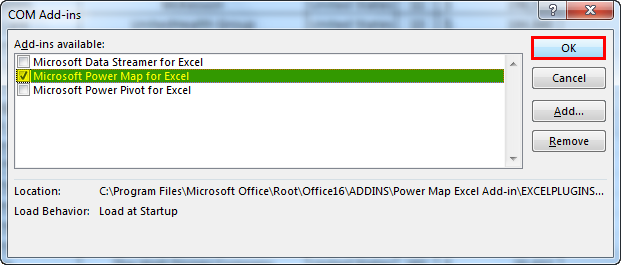
After clicking Go, it will take us to the COM Add-Ins box, Tick Mark on Microsoft Power Map to Excel, and click OK, as shown below. This will allow the installed Microsoft Power Map to be configured in Microsoft Excel 2013.
Once done, we can see Map in the Insert menu under the Power Map section, as shown below. We can configure Power Map or 3D Map in Excel 2013.
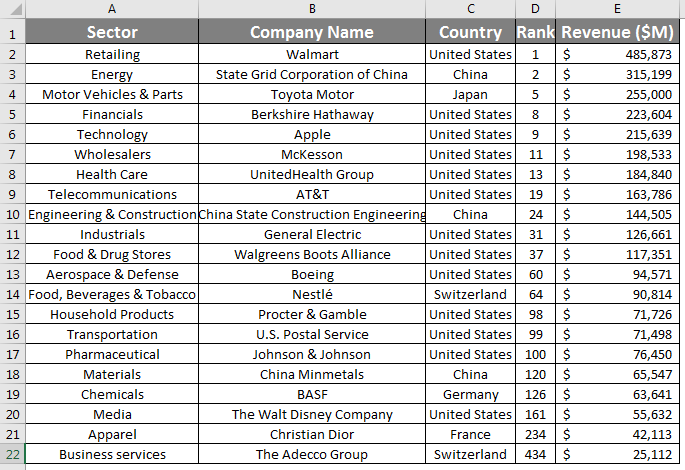
For creating a 3D Map, also known as Power Map in Excel 2013, we have some sample data of top-ranked companies worldwide. (you can download from Wikipedia)
Create 3D Maps in Excel
As we can see in the below data, we have the name of companies region-wise and ranking as per sector category. The Revenue column will be the key to be seen in 3D Map because the kind of numbers it has will be seen well in 3D towers.
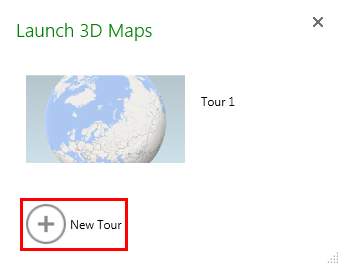
For creating a 3D Map, select the complete data we want to plot the 3D Map, then go to the Insert menu. Under Power Maps, select Maps. Once we do that, we will get the Launch Power Map window, as shown below from New Tour.
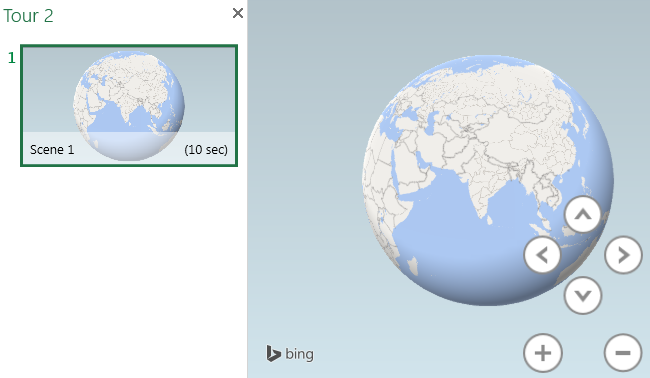
This will take us to a real 3D or Power Map, as shown in the screenshot below.
And data we selected for the 3D Map can be mapped from the right side of the screen.
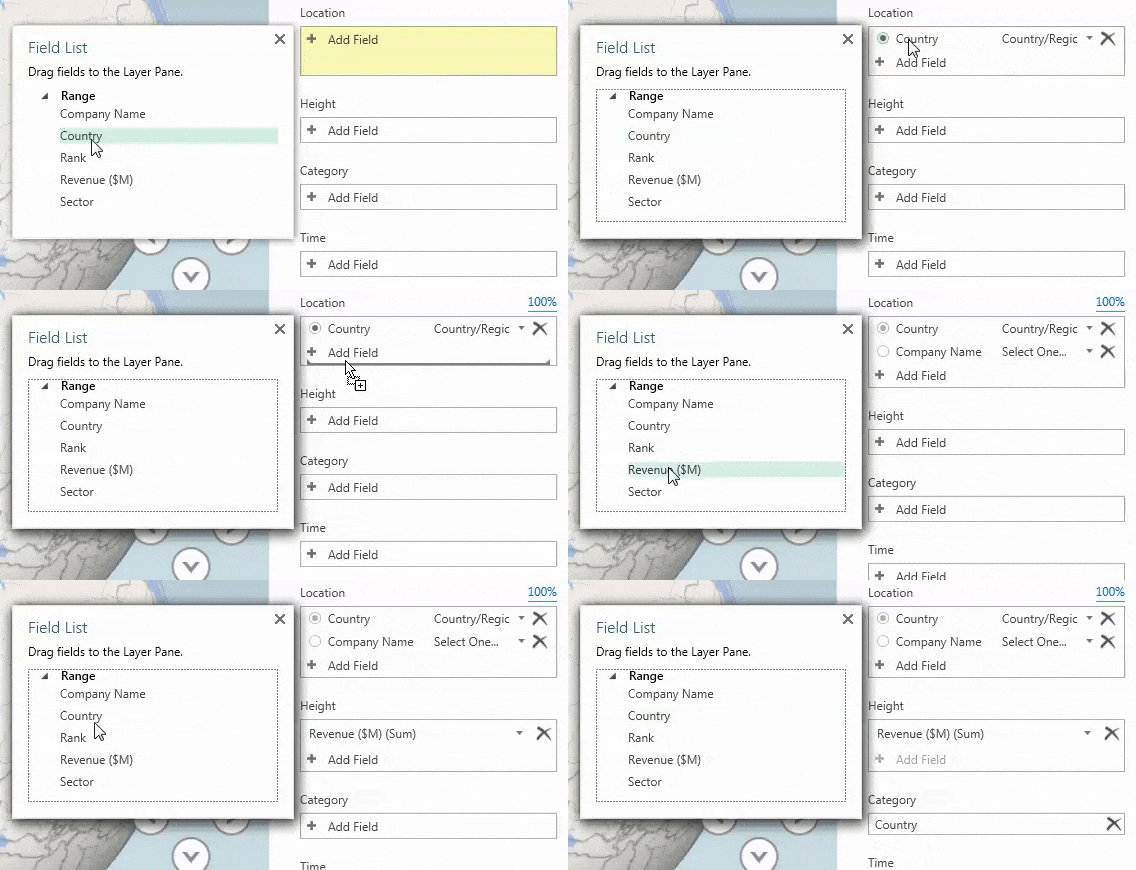
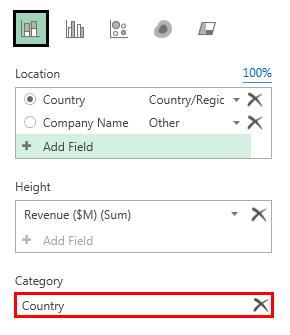
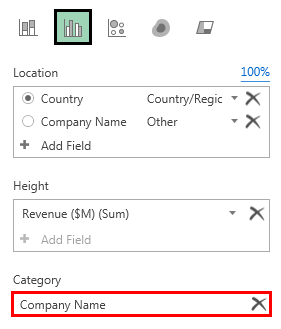
As we can see, selected data column names are already mapped with a 3D map. Now let’s link it with the map. Go to the right side of the window; we will see the layer panel. Now select columns that need to create layers for reference. Here we have selected Company Name and Country Name in the location. Here we also selected Country in category and Revenue in height, as shown below.
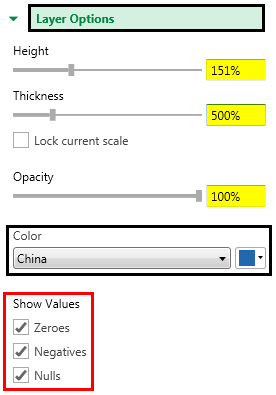
Here we can modify the graph Opacity, Thickness, and Height in the layer option as per our needs.
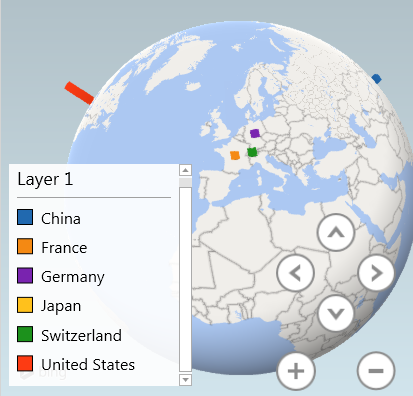
Once we have done all the parameter setup, we will see mapped revenue on the country center, as shown below. As we can see in the screenshot below, the Layer 1 window has all the list countries and the 3D globe with different color towers, representing revenue gained by listed companies.
Here are the default stacked columns, as shown below.
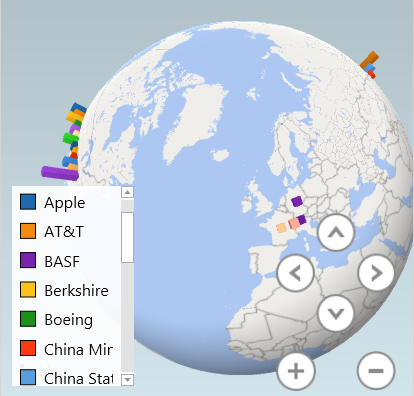
We can replace the Country with the Company name. Let’s see how it looks below.
When we select the Company name in place of Country, all the companies which belong to that country on the map are visible, and for a better view of this, we have selected a cluster column instead of default stacked columns as shown below.
This completes 3D Map creation from Power Maps in Excel.
3D Power Map has a different Home menu as we have a regular Home menu option for the simple workbook. 3D Map’s Home menu is shown below.
These are the short and precise options provided by Microsoft to make 3D maps more creative and easy to under for a regular audience. Some of the import options are;
- Map Labels – This labels all the locations, areas, country on the map.
- Flat Map makes the 3D map into a 2D one beautifully, worth trying.
- Find Location – We can find any location by this worldwide.
- Refresh Data – If anything is updated in data, use this to make it visible on the map.
- 2D Chart – It allows us to see a 3D chart in 2D.
- Legend – It shows the legends used, such as symbols and colors, to show data on the map.
- Theme – It has different themes, as well. Through this, we can use our map more creatively.
We can create a video as well by clicking on Create video icon.
Pros of 3D Maps In Excel
- It is always recommended to create a 3D map if you have data arranged region or country-wise. With the help of the 3D map, we can plot it in a more creative way.
- Creating a 3D map makes the user more precisely understand and analyze region-wise trends.
- The geographic map makes us understand the location and country better. By this, we can judge and locate a country on the map and perform our analysis based on time, weather, and geographical latitudes.
Cons of 3D Maps In Excel
- Compared with 2D Charts, functions in 3D maps are not much.
Things to Remember
- Always enable location so that our location can also be mapped on a map with GPS help.
- 3D Map works better when we connect the system to the Internet.
- If you use MS Office 2013, follow the steps in the Example to download and configure Excel 2013 to use 3D or Power Maps.
Recommended Articles
This has been a guide to 3D Maps in Excel. Here we discussed How to access 3D Maps in Excel and the Steps to download 3D Maps in Excel 2013, along with a downloadable Excel template. You may also look at these useful functions in Excel –

