Updated July 27, 2023

Introduction to Fixed Assets Examples
This article will discuss the Fixed Asset Examples, but before that, let’s understand What a Fixed Asset is?
Assets in a balance sheet can be broadly divided into two categories, which subcategorizes as follows:-
Non-Current Assets
- Fixed Assets
- Intangible Assets
- Other Non-Current Assets (investments and Deferred Charges)
Current Assets
Fixed Assets: does the business entity use the noncurrent tangible assets for income-generating operations?
- Noncurrent means the entity purchased the fixed assets to produce goods and services and will not be sold within one financial year.
- Tangible means fixed assets have a physical existence.
- Fixed assets include land, building, machinery, manufacturing and operational equipment, furniture and fixtures, vehicles, etc.
Fixed assets are called “property, plant, and equipment (PP&E)” under the company’s balance sheets as per IFRS and GAAP guidelines.
Firms other than companies can use “fixed assets” or “capital assets” in their balance sheets.
Examples of Fixed Asset (With Excel Template)
Let’s take an example to understand the calculation of Fixed Assets in a better manner.
Example #1 – Identification and Calculation of Total Fixed Assets
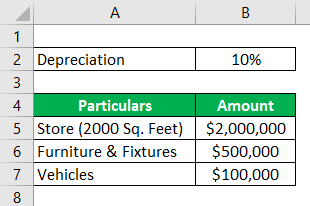
Hydra Enterprises is a proprietorship firm in the business of retail. It purchased a store (land + building) of 2000 sq. feet for $2 million to initiate its operations. It also purchased some furniture and fixtures worth $500,000; two loading vehicles cost $100,000, franchise rights worth $50,000, and brand recognition and trademarks worth $35,000.
A retail firm has large inventory investments. Hydra’s inventory on Dec 31, 2018, = $1 million
Hydra reports the store at its historical or acquisition cost. Furniture and fixtures are depreciated at 10% per annum. Vehicles are depreciated using the SLM method; each vehicle’s useful life is 10 years with a salvage value of 5000 each.
Assume all this transaction took place on January 1, 2018. Compute the fixed asset value for the December 31, 2018 financial year.
Solution:
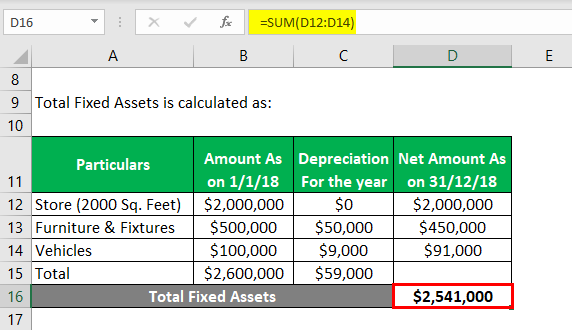
Total Fixed Assets is calculated as:
- Total Fixed Assets = $2541000
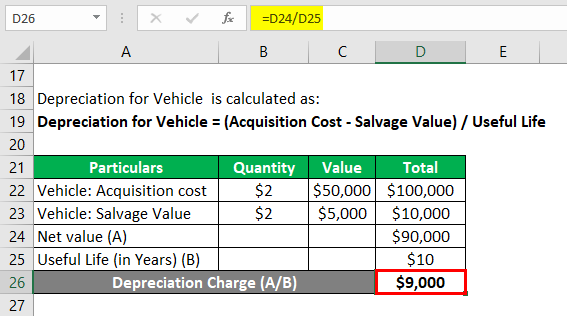
Depreciation for Vehicle calculates as:
Depreciation for Vehicle = (Acquisition Cost – Salvage Value) / Useful Life
Vehicle: Acquisition Cost
- Vehicle: Acquisition Cost = 2 * $50000
- Vehicle: Acquisition Cost = $100,000
Vehicle: Salvage Value
- Vehicle: Salvage Value = 2* $5000
- Vehicle: Salvage Value = $10,000
Depreciation for Vehicle
- Depreciation for Vehicle = Net Value / Useful Life
- Depreciation for Vehicle = ($100000 – $10000) / 10
- Depreciation for Vehicle = $9000
Example #2 – Fixed Asset Account
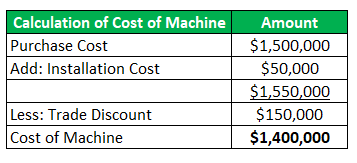
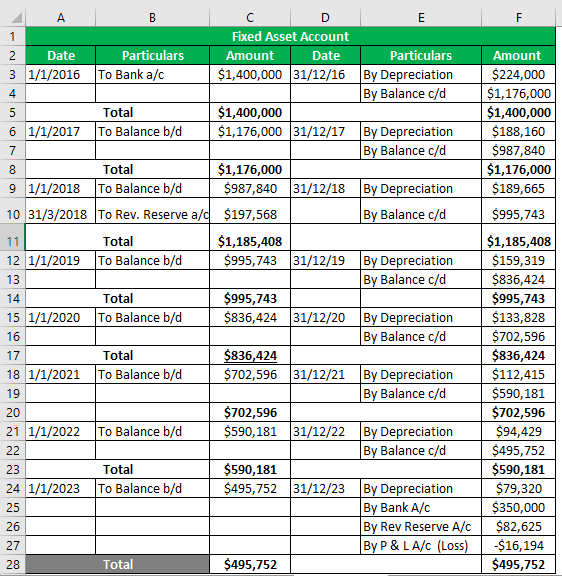
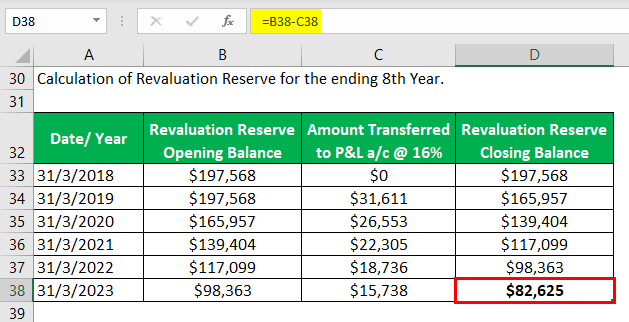
Hydra Inc purchased a machine in January 2016 worth $1.5 million (trade discount = $150,000) and incurred $50,000 for transportation and installation. The machine’s estimated useful life is 8 years, and a salvage value of $350,000. Hydra follows the WDV method @ 16% to depreciate its assets.
During revaluation in March 2018, the asset appreciated by 20%. The machine was ready to use in May 2016 but was put to use in June 2016.
Prepare a fixed asset account for the useful life of the asset.
Solution:
Fixed Asset Account
Example #3 – Fixed Asset Turnover Ratio
It measures the company’s efficiency as to how much sales it can generate using its fixed assets.
Hydra Inc is recruiting for an asset manager; Steve Rogers, in an interview, has been tasked to calculate the ratio of Fixed Assets Turnover from the given information about a business firm and make valid concluding statements.
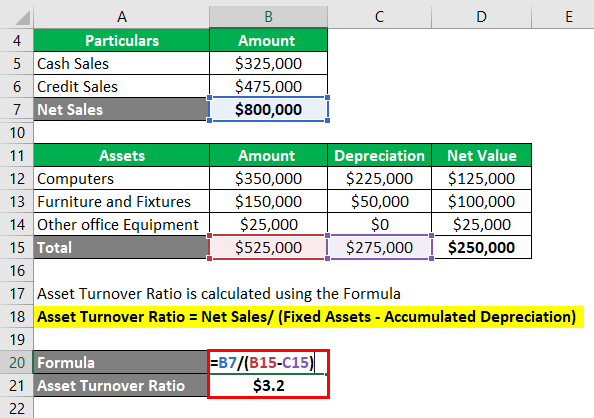
Given: according to the P&L statement of a software company, credit sales = $325,000 and cash sales = $475,000. The fixed assets include the following:-
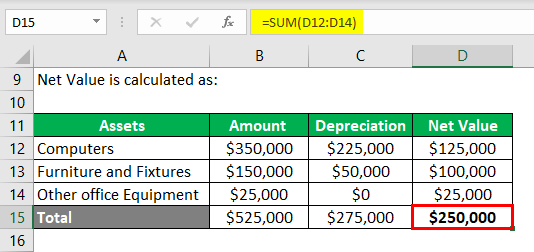
- Computers = $350,000, Accumulated depreciation = $225000
- Furniture and fixtures = $150000, Accumulated depreciation = $50000
- Other office equipment = $25000.
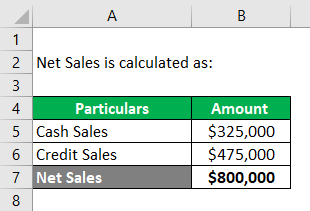
Calculation of Net Sales:-
Net Sales = Cash Sales + Credit Sales
- Net Sales = $325,000 + $475,000
- Net Sales =$800,000
Calculation of Net Value of Fixed Assets:-
Asset Turnover Ratio is calculated using the Formula
Asset Turnover Ratio = Net Sales/(Fixed Assets – Accumulated Depreciation)
- Asset Turnover Ratio = $800000 / ($525000 – $275000)
- Asset Turnover Ratio = $800000 / ($250000)
- Asset Turnover Ratio = $3.2
Note:
Mr. Steve calculates the Asset T/O ratio = 3.2, which means the company can generate sales 3.2 times its net fixed asset value.
He concluded that a ratio of 3.2 times might be a good ratio for a software industry since it does not employ heavy machinery. Still, the most important assets are computer systems and skilled labor.
However, it is essential to make a peer comparison of ratios with companies in the software industry.
Conclusion
Fixed Assets are the primary resources to conduct a business’s income-generating operations and provide a physical structure to the enterprise. Thus, an enterprise (irrespective of size) must accurately evaluate its fixed assets and report in its balance sheets.
Fixed assets determined by applying accepted methods and principles of depreciation and disposal represent the company’s true position; hence it is also a measure of its financial health.
Recommended Articles
This has been a guide to Fixed Asset Examples. Here we discuss the top 3 examples of Fixed Assets and a detailed explanation. You may also have a look at the following articles to learn more –
