Updated August 24, 2023
Project Management with Gantt Chart (Table of Contents)
Excel Project Management Template
Every project needs to be tracked for a smooth flow of the process. If you surf on Google, you will find plenty of ready templates, but not necessarily which fits your needs. Most people download and start using those ready templates and are not worried about how they actually prepared. However, knowing how they have prepared will be key to preparing your own project management templates using a Gantt chart. This article will show you how to create a project management template using the Gantt chart in excel.
How to Create Project Management Using Gantt Chart in Excel?
Excel is a popular tool for using Project Management. Let us see how we can use this with the help of an Excel spreadsheet.
Project Management Gantt Chart Example
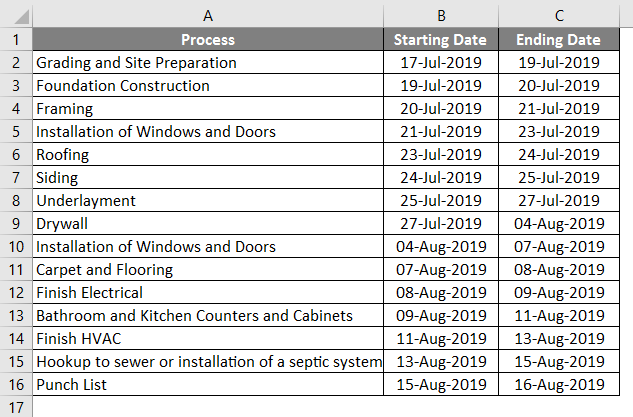
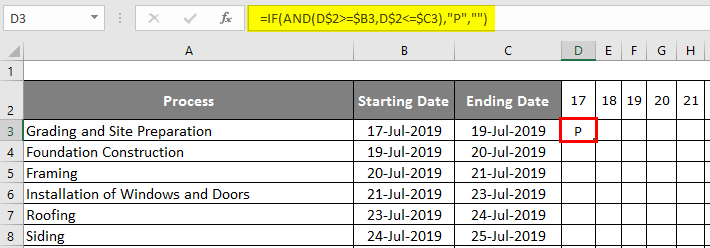
Gantt chart is the most often used technique for project management. A Gantt chart is prepared using Excel’s built-in charts, but in this article, we will show you how to build a Gantt chart using conditional formatting. Assume you have taken a construction project, you are supposed to work under tight guidelines from the starting day of the project, and you are required to finish the project in 30 days. The first thing you need to do is list construction activities. Below are the activities involved in general. Now you need to decide on the time frame of each activity, i.e., the duration time for each process. Prepare the duration from starting date to ending date.
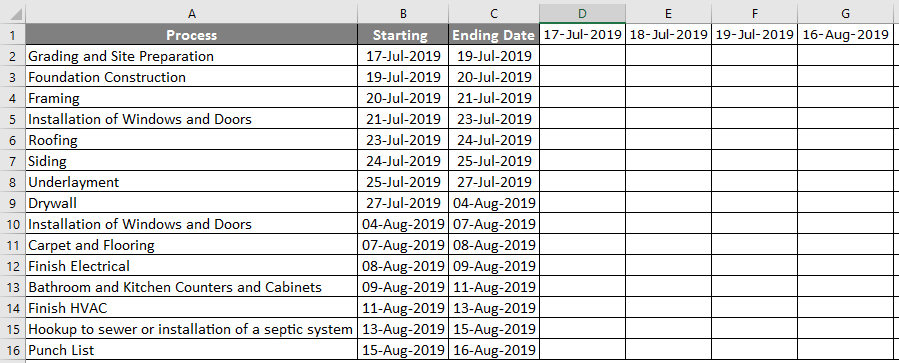
- Now on the horizontal row, enter these days like below. The starting date will be 17th July 2019, and the end date will be 16th Aug 2019.
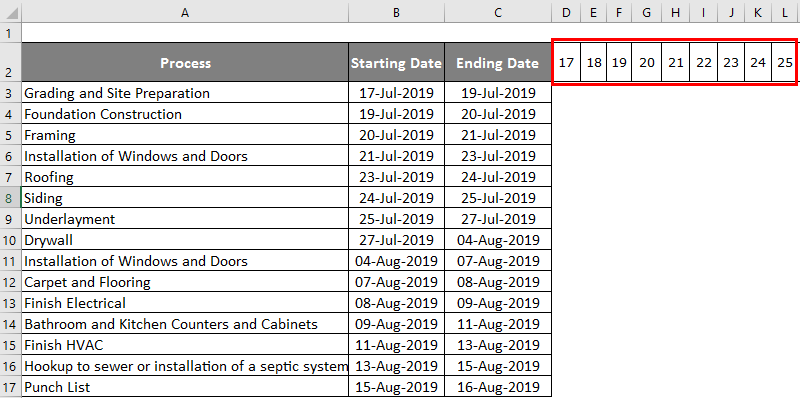
- One of the problems with this is that dates are too long to see in the single view; you have to change the date format from “DD-MMM-YYYY” to only the “DD” format to minimize the column width.
- In these small boxes, we need to decide which date each activity is supposed to close. Enter the below formula to declare the closing date.
- After using the formula, the output is shown below.
- This formula says if the horizontal date is >= starting date and the horizontal date is <= ending date, the result should be “P” or else blank.
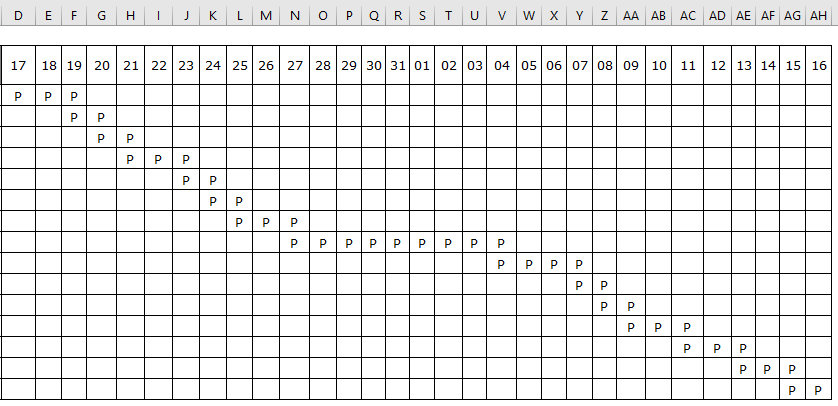
- To apply the formula to all the remaining cells, we must first select and press Ctrl + D and then Ctrl + R.
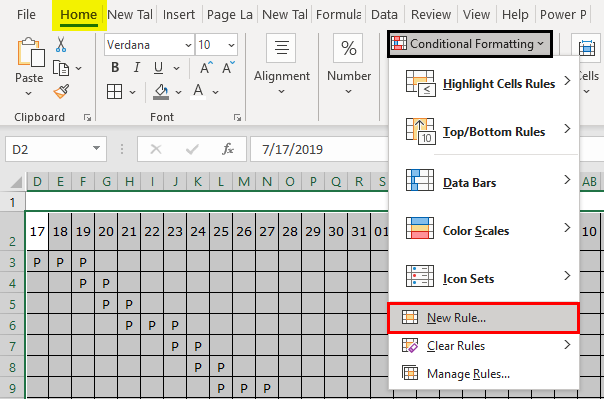
Now we need to apply Conditional Formatting for this. Follow the below steps to apply conditional formatting.
Step 1: Select the area that we have applied the formula to declare “P”.
Step 2: Go to Conditional Formatting and click “New Rule”.
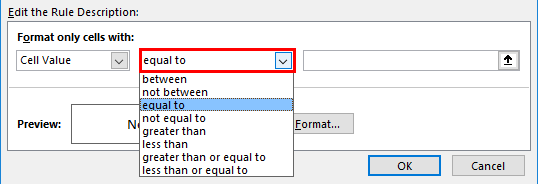
Step 3: In the New Rule window, select “Format only cells that contain”.
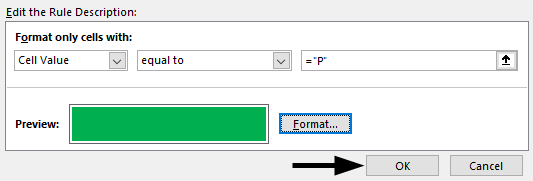
Step 4: In the formula section, choose “equal to” and enter the formula below.
Now we need to apply the Conditional Formatting to the cell with the letter “P”, So enter the formula as “P”.
Step 5: Now click on “Format”.
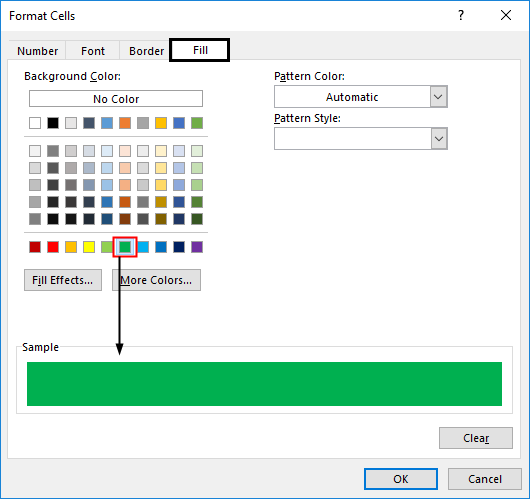
Step 6: Now, we will see the “Format Cells” window. In this window, we can choose the format we want to apply to the cells with the letter “P”. Go to the “Fill” tab and choose the color “Green”.
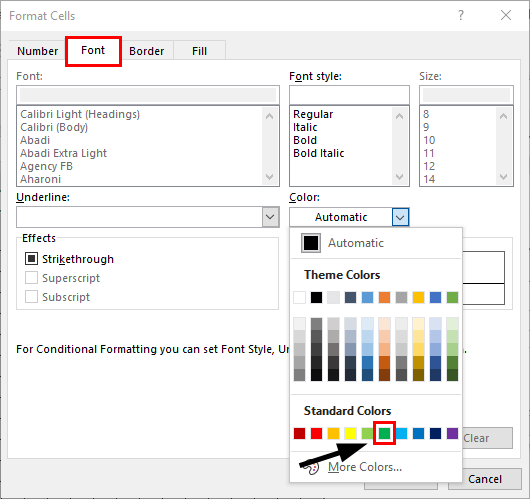
Step 7: Go to the “Font” tab in the same window and choose only the ” Green ” font color. I have selected green because we don’t want to see the letter “P” in the Gantt chart.
Step 8: Now click on Ok to apply the formatting. It will take you back to the previous window of conditional formatting. Click ” OK ” in this window to complete the conditional formatting.
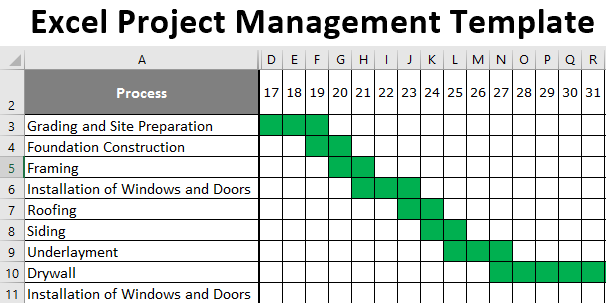
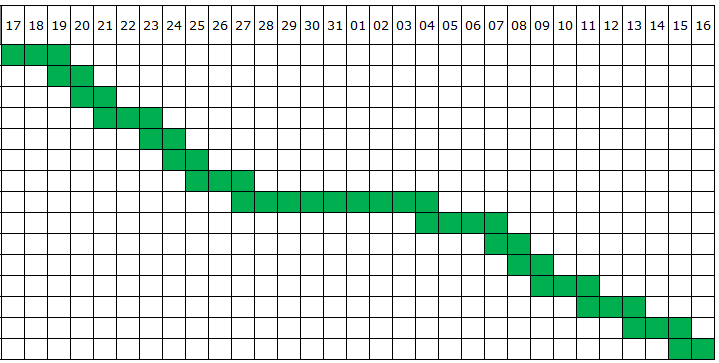
Step 9: Now, our Gantt chart, which tracks our project construction, is ready.
Things to Remember About Project Management with Gantt Chart
- Creating Project Management with Gantt Chart is quite a complex process. It is not always easy for intermediate users of Excel.
- Through conditional formatting, we can easily create a Gantt chart to track any project.
- We have given the example of construction; based on your requirement, you need to change the activity list, starting date, and ending date, and the same needs to be updated horizontally.
- You can change the color of the chart while applying conditional formatting.
Recommended Articles
This is a guide to Project Management with Gantt Chart. Here, we discuss creating project management with a Gantt chart with practical examples and a downloadable Excel template. You can also go through our other suggested articles –

