Updated July 25, 2023
Producer Surplus Formula (Table of Contents)
What is the Producer Surplus Formula?
The term “producer surplus” refers to the gap between what the sellers are willing to accept as the selling price of a product and the price that they actually receive by selling at the market price.
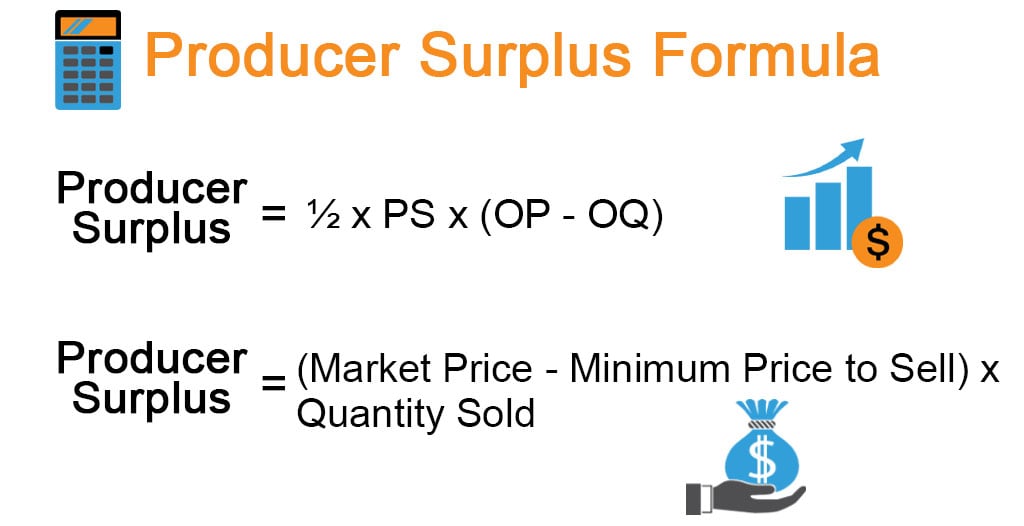
In other words, the producer surplus is the benefit enjoyed by a producer by selling the given product at the market price. The formula for producer surplus can be derived as the product of the quantity of the goods sold and the difference between the minimum price at which the seller is willing or able to sell and the market price. Mathematically, it is represented as,
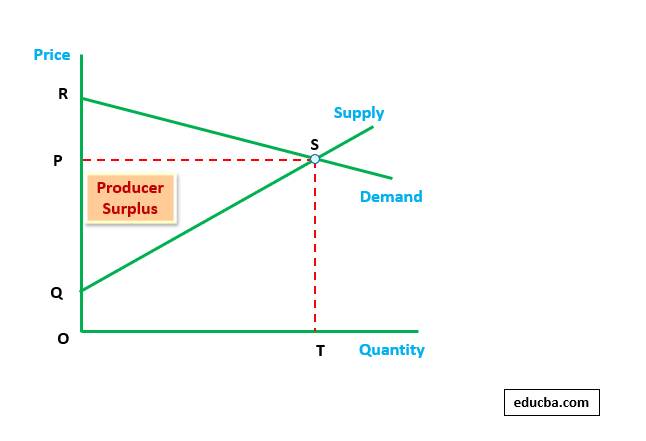
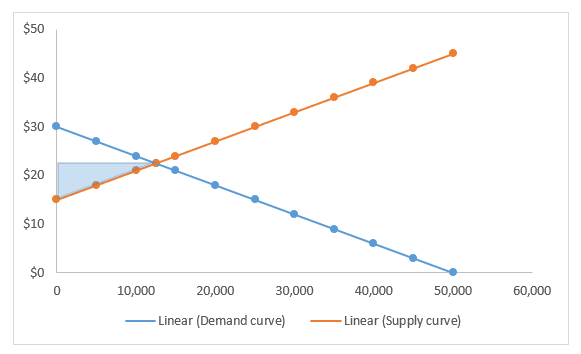
On the other hand, the formula for producer surplus can also be extended for the market as a whole i.e. multiple sellers. In the illustrated graph shown below, the area of ΔQPS represents the producer surplus which is surrounded by axis for a price, upward-sloping supply curve and a horizontal line is drawn parallel to the axis for quantity sold. Mathematically, it is represented as,
In the graph, point Q and P represent the minimum price that the producer is willing to accept as selling price and the actual market price respectively on the ordinate, while point S or T corresponds to the quantity sold at equilibrium i.e. demand = supply.
Examples of Producer Surplus Formula (With Excel Template)
Let’s take an example to understand the calculation of Producer Surplus in a better manner.
Producer Surplus Formula – Example #1
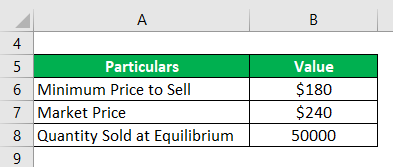
Let us take the example of a producer who is a manufacturer of niche products used in the widgets. The manufacturing cost of the product adds up to around $150 per piece and so the producer is willing to sell the product at $180. However, due to a sudden spike in the demand for the widget, the demand for the niche product also surged resulting higher market price of $240. Calculate the producer surplus for the manufacturer if they sold 50,000 pieces during the year.
Solution:
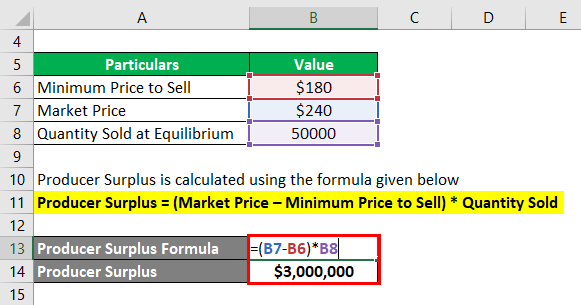
Producer Surplus is calculated using the formula given below
Producer Surplus = (Market Price – Minimum Price to Sell) * Quantity Sold
- Producer Surplus = ($240 – $180) * 50,000
- Producer Surplus = $3,000,000
Therefore, the manufacturer earned a producer surplus of $3 million during the year.
Producer Surplus Formula – Example #2
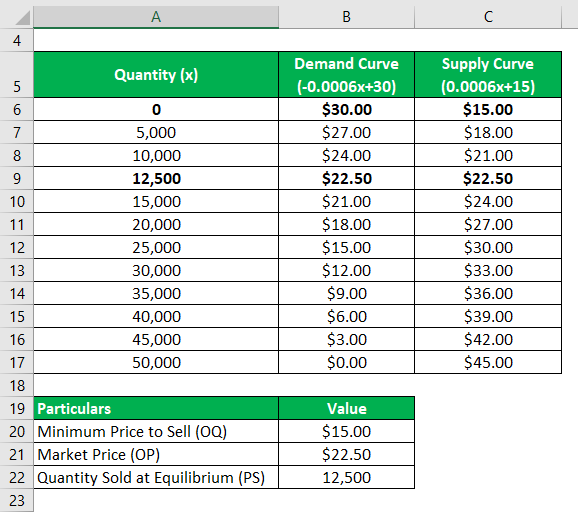
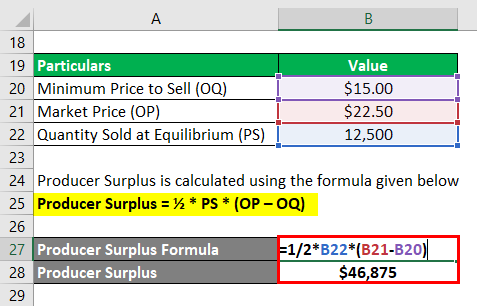
Let us take another example of a market where the Demand curve and Supply curve governed by (-0.0006x + 30) and (0.0006x + 15) where ‘x’ is the quantity of goods sold. Let us take the market situation a certain of the year. Calculate the producer surplus in the given market scenario.
Solution:
From the above table,
- Minimum Price to Sell (OQ) = $15.00 (Zero Demand)
- Market Price (OP) = $22.50 (Equilibrium Price)
- Quantity Sold (PS) = 12,500 (Equilibrium Quantity)
Producer Surplus is calculated using the formula given below
Producer Surplus = ½ * PS * (OP – OQ)
- Producer Surplus = ½ * 12,500 * ($22.50 – $15.00)
- Producer Surplus = $46,875
Therefore, the producer surplus is $46,875 for the month.
Explanation
The first formula for producer surplus can be derived by using the following steps:
Step 1: Firstly, determine the minimum at which the producer is willing or able to sell the subject good.
Step 2: Next, determine the actual selling price of the product at which it is being traded in the market place. It will depend on various factors like the product’s utility, uniqueness, availability in the market, etc.
Step 3: Next, determine the number of units (quantity) of the product being sold by the producer in the market.
Step 4: Finally, the formula for producer surplus can be derived as the product of the quantity of the goods sold (step 3) and the difference between the minimum price (step 1) at which the seller is willing to sell and the market price (step 2) as shown below.
Producer Surplus = (Market Price – Minimum Price to Sell) * Quantity Sold
On the other hand, the formula for the producer surplus for the market as a whole can be derived by using the following steps:
Step 1: Firstly, draw the Demand curve and Supply curve with quantity on the X-axis and price on the Y-axis.
Step 2: Next, determine the price at which the producer is willing to sell and it is denoted by the point Q in the graph.
Step 3: Next, determine the point of intersection between the Demand and Supply curve which represents the market equilibrium denoted by point S. Draw a line parallel to the X-axis to meet the Y-axis at point P which is the market price.
Step 4: So, OQ is the minimum price the seller is willing to accept, OP is the market price and PS is the quantity sold. Therefore, the formula for producer surplus can be represented as,
Producer Surplus = ½ * PS * (OP – OQ)
Relevance and Use of Producer Surplus Formula
It is very important to understand the concept of producer surplus as it helps in making decisions pertaining to price-output setting and value pricing under various marketing strategies. The producer surplus and consumer surplus combine to become an economic surplus. However, if the producer is able to sell at the maximum price that the consumer is willing to pay then the entire economic surplus becomes the producer surplus which can be indicative of a monopoly market.
Producer Surplus Formula Calculator
You can use the following Producer Surplus Calculator
| Market Price | |
| Minimum Price to Sell | |
| Quantity Sold | |
| Producer Surplus | |
| Producer Surplus = | Market Price - Minimum Price to Sell * Quantity Sold | |
| 0 - 0 * 0 = | 0 |
Recommended Articles
This is a guide to Producer Surplus Formula. Here we discuss how to calculate Producer Surplus along with practical examples. We also provide a Producer Surplus calculator with a downloadable excel template. You may also look at the following articles to learn more –

