Updated July 4, 2023
Introduction to JavaFX Bar Chart
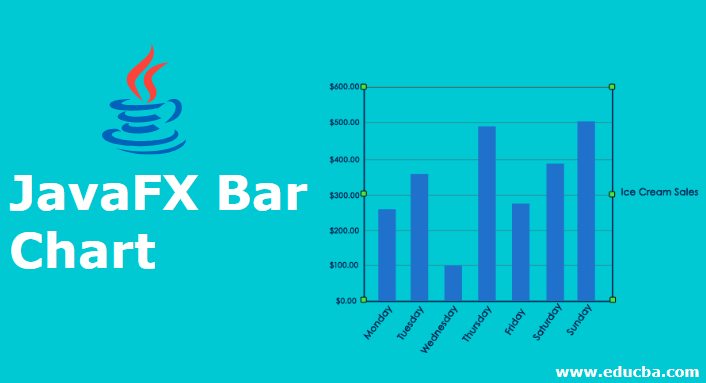
In JavaFX, Bar charts are used to display the data in the form of rectangle bars where height and length are based on the value’s proportion. A bar chart can be created by instantiating the class JavaFX.scene.chart.BarChart. Let us look into syntax, constructor, and methods of JavaFX Bar chart in detail.
Syntax:
BarChart ll = new BarChart(x, y);Here, x and y are the two axes of the chart.
Constructors of JavaFX Bar Chart
It has three constructors.
- BarChart(Axis X, Axis Y): A new instance of Bar Chart will be created with the specified axis.
- BarChart(Axis X, Axis Y, ObservableList<xychart.series> D): A new instance of Bar Chart will be created with the specified axis and data.
- BarChart(Axis X, Axis Y, ObservableList<xychart.series> D, double categoryGap): A new instance of Bar Chart will be created with the axis, data, and category gap mentioned.
Methods of JavaFX Bar Chart
There are several methods to perform different functionalities of a bar chart.
- dataItemAdded(Series<X, Y> s,int index, XYChart.Data<X, Y> i): When a data item i is added to the series s, this method is called.
- dataItemChanged(Data<X, Y> i): When a data item i is changed, this method is called. Item can be x value, y value or extra value.
- dataItemRemoved(Data<X, Y> i, XYChart.Series<X, Y> s ): When a data item i is removed and still visible on the chart, this method is called.
- layoutPlotChildren(): In order to update and layout the plot children, this method will be called.
- seriesAdded(Series<X, Y> s, int sIndex ): A series s will be added to the chart.
- seriesRemoved(Series<X, Y> s): When a series s is removed and still visible on the chart, this method is called.
- updateLegend(): This method will be called when a series is removed or added and the legend has to be updated.
- barGapProperty(): The gap that has to be between bars of the same category.
- categoryGapProperty(): The gap that has to be between bars of separate categories.
- getBarGap(): barGap property’s value will be returned.
- getBarGap(): barGap property’s value will be returned.
- getCategoryGap(): CategoryGap property’s value will be returned.
- setBarGap(double v): barGap property’s value will be set.
- setCategoryGap(double v): CategoryGap property’s value will be set.
How to Create JavaFX Bar Chart?
In order to create it, the following steps can be performed.
1. Create a class
Create a class that extends from the application class. For this, import the class JavaFX.application.Application.
public class JavaFXChartsExample extends Application {
}
2. Configure X and Y Axes
There are two types of axis- CategoryAxis and NumberAxis. Axes details have to be mentioned as follows.
//x axis
CategoryAxis x = new CategoryAxis();
x.setLabel("Mobile");
//y axis
NumberAxis y = new NumberAxis()<>;
3. Create the bar chart
Instantiate the class javafx.scene.chart.BarChart. The following syntax is used for BarChart.
//bar chart creation>
BarChart bc = new BarChart(x, y);
4. Add Data to the series and chart
This is the most crucial step in this process where an instance is created for XYChart.Series. After that, the values that need to be displayed in the chart will be added using the below syntax.
XYChart.Series sr = new XYChart.Series();
sr.getData().add(new XYChart.Data( 1, 567));
Add data to the series created above using the below syntax.
ll.getData().add(sr);5. ConfigureGroup and Scene
Next, a group and scene will be created. The scene is created by instantiating the class javafx. scene once the group is created. Then only the group can be passed as one of the arguments in the scene.
VBox vbox = new VBox(ll);
//create scene
Scene sc = new Scene(vbox, 400, 200);
//set scene
s.setScene(sc);
//set height and width
s.setHeight(350);
s.setWidth(1250);
//display the result
s.show();
Program to implement JavaFX Bar Chart
Now, let us see different JavaFX programs to implement a bar chart in order to get a better understanding of the same.
Program 1
import javafx.application.Application;
import javafx.scene.Scene;
import javafx.scene.chart.BarChart;
import javafx.scene.chart.CategoryAxis;
import javafx.scene.chart.NumberAxis;
import javafx.scene.chart.XYChart;
import javafx.scene.layout.VBox;
import javafx.stage.Stage;
public class JavaFXChartsExample extends Application {
@Override
public void start(Stage s) {
s.setTitle("BarChart Sample");
//x axis
CategoryAxis x    = new CategoryAxis();
x.setLabel("Mobile");
//y axis
NumberAxis y = new NumberAxis();
y.setLabel("count");
//bar chart creation
BarChart bc = new BarChart(x, y);
//add values
XYChart.Series ds = new XYChart.Series();
ds.setName("January");
ds.getData().add(new XYChart.Data("Samsung", 33));
ds.getData().add(new XYChart.Data("Xiaomi"  , 25));
ds.getData().add(new XYChart.Data("Honor"  , 10));
bc.getData().add(ds);
//vertical box
VBox vbox = new VBox(bc);
Scene sc = new Scene(vbox, 300, 200);
s.setScene(sc);
s.setHeight(300);
s.setWidth(1200);
s.show();
}
public static void main(String[] args) {
Application.launch(args);
}
}
Output:
A vertical bar chart is created with 3 categories Samsung, Xiaomi, Honor, count on y-axis and mobile on the x-axis.
Program 2
import javafx.application.Application;
import javafx.scene.Scene;
import javafx.scene.chart.BarChart;
import javafx.scene.chart.CategoryAxis;
import javafx.scene.chart.NumberAxis;
import javafx.scene.chart.XYChart;
import javafx.stage.Stage;
public class JavaFXBarChartExample extends Application {
//declare all the string values
final static String A = "Happy";
final static String B = "Sad";
final static String C = "Mixed emotions";
@Override public void start(Stage s) {
//set title
s.setTitle("Bar Chart Sample");
//x and y axis
final NumberAxis x = new NumberAxis();
final CategoryAxis y = new CategoryAxis();
//create bar chart
final BarChart<Number,String> b =
new BarChart<Number,String>(x,y);
b.setTitle("Emotions of people");
//set title for x axis
x.setLabel("Percentage");
x.setTickLabelRotation(90);
//set title for y axis
y.setLabel("Emotion");
//dataset on 1999
XYChart.Series s1 = new XYChart.Series();
s1.setName("1999");
s1.getData().add(new XYChart.Data(10, A));
s1.getData().add(new XYChart.Data(60, B));
s1.getData().add(new XYChart.Data(30, C));
//dataset on 2009
XYChart.Series s2 = new XYChart.Series();
s2.setName("2009");
s2.getData().add(new XYChart.Data(50, A));
s2.getData().add(new XYChart.Data(30, C));
s2.getData().add(new XYChart.Data(20, B));
//dataset on 2019
XYChart.Series S3 = new XYChart.Series();
S3.setName("2019");
S3.getData().add(new XYChart.Data(70, A));
S3.getData().add(new XYChart.Data(25, B));
S3.getData().add(new XYChart.Data(5, C));
//create scene
Scene sc  = new Scene(b,700,500);
b.getData().addAll(s1, s2, S3);
//set scene
s.setScene(sc);
//display result
s.show();
}
public static void main(String[] args) {
launch(args);
}
}
Output:
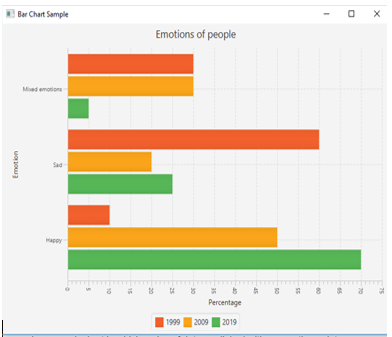
In this program, a horizontal bar chart is created with 3 categories, percentage on x-axis and emotion on the y-axis.
Conclusion
There are several charts used to represent data. A bar chart is one such chart in which data is represented in rectangular bars.
Recommended Articles
This has been a guide to JavaFX Bar Chart. Here we also discuss how to create JavaFX Bar Chart, its syntax, constructor, method, and examples. You may also have a look at the following articles to learn more –


