Updated July 21, 2023
Fixed Asset Turnover Ratio Formula (Table of Contents)
What is the Fixed Asset Turnover Ratio Formula?
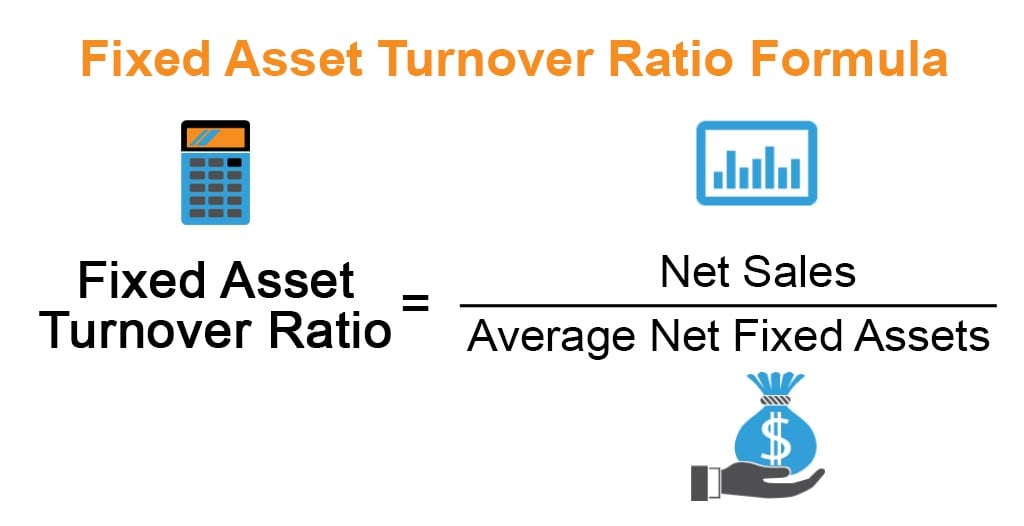
The term “Fixed Asset Turnover Ratio” refers to the operating performance metric that shows how efficiently a company utilizes its fixed assets (machinery and equipment) to generate sales. In other words, this ratio is used to determine the amount of dollar revenue generated by each dollar of available fixed assets.
The fixed asset turnover ratio formula is expressed as the subject company’s net sales divided by the average value of its net fixed assets, which is mathematically represented as,
Example of Fixed Asset Turnover Ratio Formula (With Excel Template)
Let’s take an example to understand the calculation of the Fixed Asset Turnover Ratio in a better manner.
Example #1
Let us take the example of two companies, ABC Inc. and XYZ Inc., to illustrate the fixed asset turnover ratio concept. Both companies belong to the same industry of ice cream manufacturing. Calculate the fixed assets turnover ratio of both of those businesses on the basis of the above-given information. Also, calculate which company utilizes its fixed assets better. According to the latest annual reports, the following information is available:
Solution:
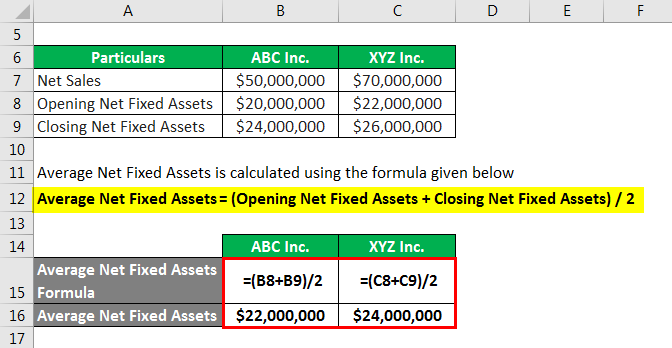
The formula to calculate Average Net Fixed Assets is as below:
Average Net Fixed Assets = (Opening Net Fixed Assets + Closing Net Fixed Assets) / 2
For ABC Inc.
- Average Net Fixed Assets = ($20 million + $24 million) / 2
- Average Net Fixed Assets = $22 million
For XYZ Inc.
- Average Net Fixed Assets = ($22 million + $26 million) / 2
- Average Net Fixed Assets = $24 million
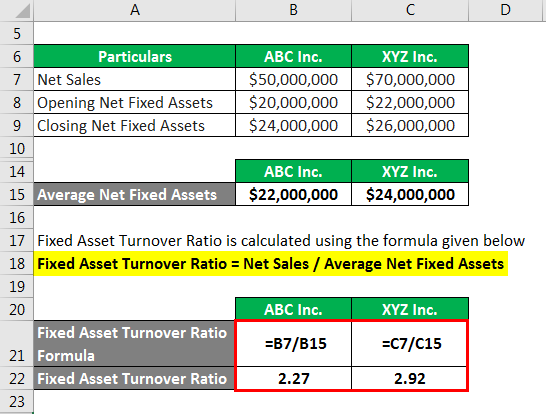
The formula to calculate the Fixed Asset Turnover Ratio is as below:
Fixed Asset Turnover Ratio = Net Sales / Average Net Fixed Assets
For ABC Inc.
- Fixed Asset Turnover Ratio = $50 million / $22 million
- Fixed Asset Turnover Ratio = 2.27x
For XYZ Inc.
- Fixed Asset Turnover Ratio = $70 million / $24 million
- Fixed Asset Turnover Ratio = 2.92x
Therefore, XYZ Inc.’s fixed asset turnover ratio is higher than that of ABC Inc., which indicates that XYZ Inc. was more effective in the use of its fixed assets during 2019.
Example #2
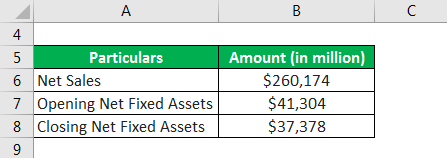
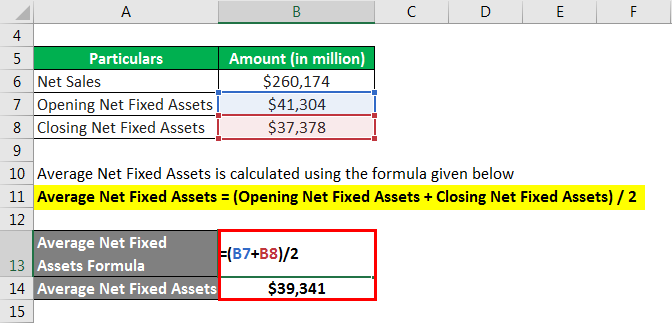
Let us take Apple Inc.’s example now’s annual report for the year 2019 and illustrate the computation of the fixed asset turnover ratio. During the year, the company booked net sales of $260,174 million, while its net fixed assets at the start and end of 2019 stood at $41,304 million and $37,378 million, respectively. Calculate Apple Inc.’s fixed assets turnover ratio based on the given information.
Solution:
The formula to calculate Average Net Fixed Assets is as below:
Average Net Fixed Assets = (Opening Net Fixed Assets + Closing Net Fixed Assets) / 2
- Average Net Fixed Assets = ($41,304 million + $37,378 million) / 2
- Average Net Fixed Assets = $39,341 million
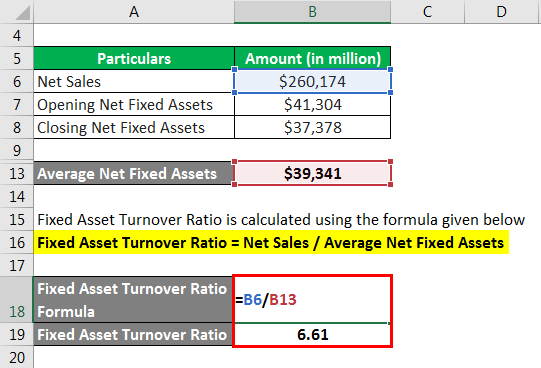
The formula to calculate the Fixed Asset Turnover Ratio is as below:
Fixed Asset Turnover Ratio = Net Sales / Average Net Fixed Assets
- Fixed Asset Turnover Ratio = $260,174 million / $39,341 million
- Fixed Asset Turnover Ratio = 6.61x
Therefore, Apple Inc.’s fixed asset turnover ratio was 6.61x for the year 2019.
Source Link: Apple Inc. Balance Sheet
Explanation
The formula for the Fixed Asset Turnover Ratio can be calculated by using the following steps:
Step 1: First, determine the value of the net sales the company recognizes in its income statement for the given period.
Step 2: Next, the company’s net fixed assets value at the beginning of the period (opening) and at the end of the period (closing). Now, compute the average net fixed assets for the given period based on the opening and closing value of the net fixed assets.
Step 3: Finally, the formula for the fixed asset turnover ratio can be derived by dividing net sales (step 1), as shown below, by the average net fixed assets (step 2).
Relevance and Use
It is important to understand the concept of the fixed asset turnover ratio as it is helpful in assessing the operational efficiency of a company. This ratio primarily applies to manufacturing-based companies as they have huge investments in plants, machinery, and equipment. As such, fixed assets’ utilization is critical for their business well-being. Investors and analysts can use the ratio to compare the performances of companies operating in similar industries.
Although it is a very useful metric, one of the major flaws with this ratio is that it can be influenced by manipulating the depreciation charge, as the ratio is calculated based on the net value of fixed assets. So, the higher the depreciation charge, the better will be the ratio, and vice versa.
Fixed Asset Turnover Ratio Formula Calculator
You can use the following Calculator
| Net Sales | |
| Average Net Fixed Assets | |
| Fixed Asset Turnover Ratio | |
| Fixed Asset Turnover Ratio = | Net Sales /Average Net Fixed Assets |
| = | 0 /0 = 0 |
Recommended Articles
This is a guide to the Fixed Asset Turnover Ratio Formula. Here we discuss calculating the Fixed Asset Turnover Ratio along with practical examples. We also provide a Fixed Asset Turnover Ratio calculator with a downloadable Excel template. You may also look at the following articles to learn more –

