Updated March 27, 2023
Introduction to Matlab Errorbar
Error bar is a vertical or horizontal line on any graph or plot with respect to errors. There are various ways to represent error bars with multiple variables. Error bars have some properties such as line width, line size, color, marker, and data. Line width represents the width of the error line. Line size decides the size of the error bar. by using the color option we can change the color of the error bar as red, blue, green, etc. marker is used to represents marks or points on plot and co-ordinates. We can adjust the position of error bar as per our need horizontal or vertical. In this topic, we are going to learn about Matlab Errorbar.
Syntax –
errorbar (x ,err)

errorbar (variable, error name)
errorbar (var1 ,var2 ,err)

errorbar (variable name 1, variable name2, error name)
e = errorbar (var1 ,var2 ,err)

error = errorbar (parameters, error name)
Marker = '*'

error name.marker = ‘mark symbol’
Marker Size = 25;

error name. Marker size =size
Color = 'green';

error name.color = color name
Why we use Matlab Errorbar?
In Matlab, the Error bar is used to draw vertical or horizontal lines on any plot. to represent errors graphically error bar is used. In which we can use various properties to display error graphs or error plots. we can change marker points by multiple symbols as well as we can change the size of that marker. Illustration of marker symbol and size is given in example four. By default color of the error, the bar is blue and the marker is ‘ * ’.
Examples of Matlab Errorbar
Here are the following examples of Matlab Errorbar mention below
Example #1
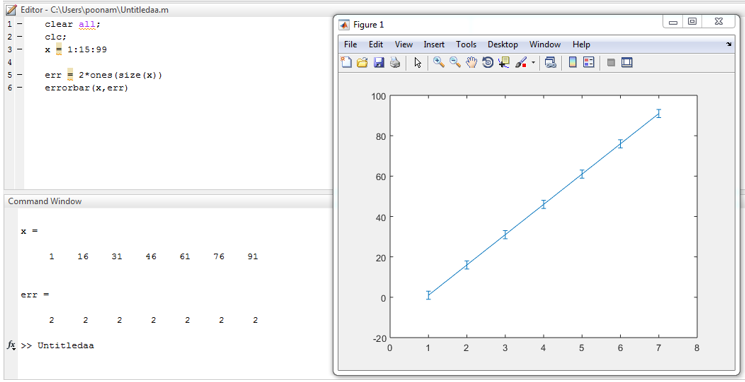
Let us consider one example with a single variable ‘x ’. Values of ‘x ’ varies from 1 to 99 with a uniform distance of 15. And the error is applied on variable x as multiple of 2.
Code:
clear all;

clc ;

x = 1 : 15 : 99

err = 2 * ones(size(x))

errorbar ( x ,err)
Output:
Example #2
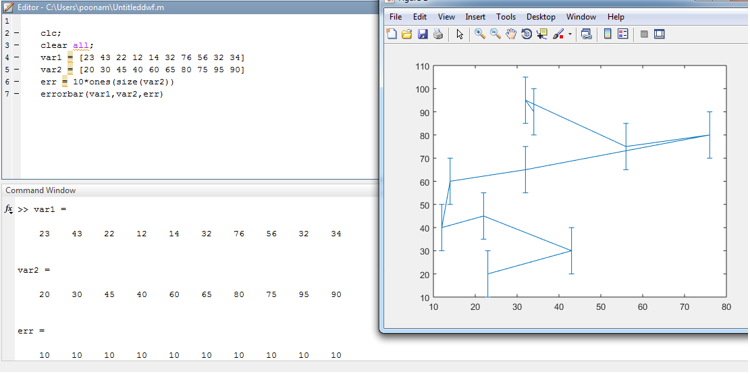
Let us consider two-variable var 1 and var 2 with random values varies from 10 to 100. And one error is applied on the plot with respect to variable 2 in multiples of eight.
Code:
Clc ;

clear all;

var1 = [ 23 43 22 12 14 32 76 56 32 34 ]
var2 = [ 21 32 45 42 63 65 88 77 94 99 ]
err = 8 * ones(size ( var2))

errorbar ( var1,var2,err)
Output:
Example #3
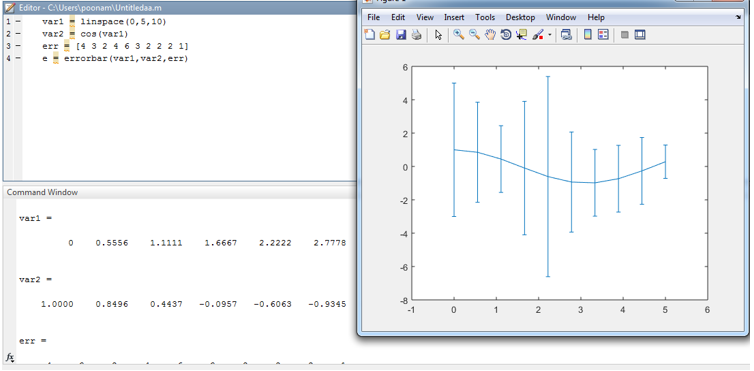
In this example, we assume two different continuous functions instead of variables. One function is line space stored in var 1 and the second function is trigonometric cosine function, which is stored in var 2.
Code:
var1 = line space (0, 5, 10)

var2 = cos (var1)

err = [4 3 2 4 6 3 2 2 2 1]
e = errorbar (var1, var2, err)
Output:
Example #4
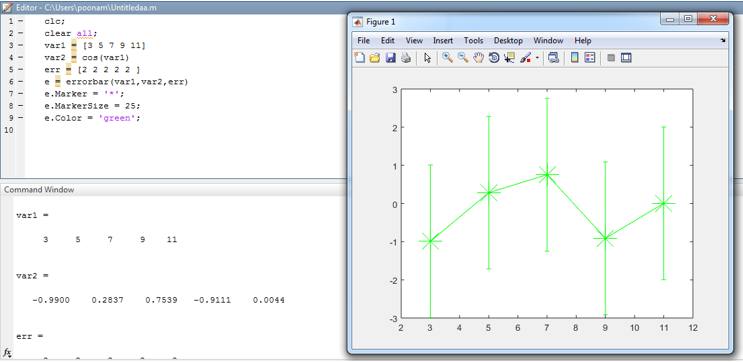
In this example, we have used the properties of the error bar. for marker, we have assigned symbol ‘ * ’.marker size is 25 and the color assigned to the error bar is green.
Code:
Clc ;

clear all ;

var1 = [3 5 7 9 11]
var2 = cos (var1)

err = [2 2 2 2 2 ]
e = errorbar (var1, var2, err)

e .Marker = ' * ';

e .Marker Size = 25;

e .Color = ' green ';
Output:
Conclusion
In this article, we have seen that representation error graph makes graph or plot very efficient. By using error bar we can properly display the errors on each coordinates of graph. Error bar can be represented in error bar, error line or error plot.
Recommended Articles
This is a guide to Matlab Errorbar. Here we discuss the basic concept, Examples of Matlab Errorbar along with output and Why we use it. You may also have a look at the following articles to learn more –


