Updated July 21, 2023

Definition of Inventory Turnover Ratio
Turnover stands for the number of times we rotate a particular aspect of the business, therefore inventory turnover makes inventory the center of attraction and shows how many times the inventory comes in and goes out in a given period of time as a symbol of the efficiency of the company and the demand for the product. The ratio is abbreviated as ITR for convenience.
A product that is in high demand will have a very high inventory turnover ratio and the ratio also suggests how quickly the inventory is being sold. If the turnover is high, then we can assume that the product is not about to get obsolete. If the turnover is low, it means that the inventory is piling up in the company and that implies too much money being blocked in the same. It might be the case that the product is no longer desired by the consumers as it has become obsolete and therefore will become a liability for the company if it sells it for lower price or doesn’t sell it at all
Industries such as technology or fashion need to know whether their products are not getting obsolete because these industries witness very quick changes in tastes and preferences or even advancement to a newer and better product.
Formula to Calculate Inventory Turnover Ratio
The formula for Inventory Turnover Ratio is as follows:
Another formula that is used in practice is:
Average inventory is the average of beginning and ending inventory, however, at times we may even take the end of the year inventory if beginning inventory is not available for the company we are analyzing.
The formula is also used to calculate the number of days required to sell a lot of inventory during a period of time, most commonly a year.
Example of Inventory Turnover Ratio (With Excel Template)
Let’s take an example to understand the calculation in a better manner.
Example #1
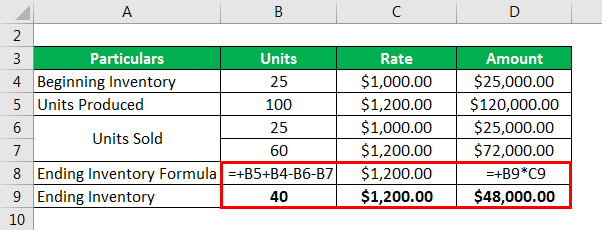
Suppose a company uses the FIFO method of inventory and has the following information:
Solution:
Ending Inventory is Calculated as
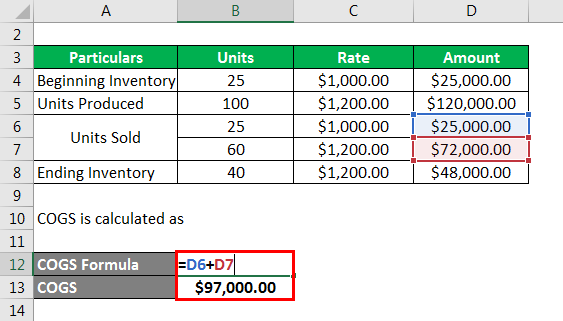
COGS is calculated as
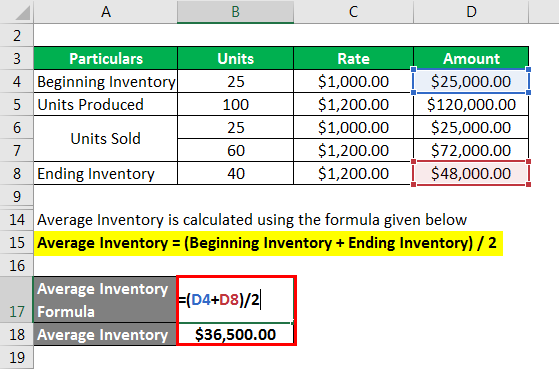
Average Inventory is calculated using the formula given below
Average Inventory = (Beginning Inventory + Ending Inventory) / 2
- Average Inventory = ($25,000.00 + $48,000.00) /2
- Average Inventory = $36,500.00
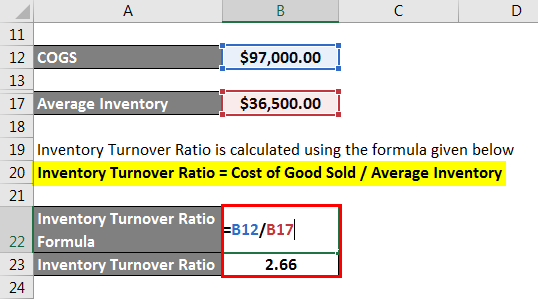
Inventory Turnover Ratio is calculated using the formula given below
Inventory Turnover Ratio = Cost of Good Sold / Average Inventory
- Inventory Turnover Ratio = $97,000.00 / $36,500.00
- Inventory Turnover Ratio = 2.66
As the inventory turnover ratio is greater than 1, it implies efficient management of inventory in the company. Had the denominator been higher than the numerator, it would mean an inventory pile-up or lower efficiency in the management of the same, which would need to be investigated further to find out the causes and rectify them.
Importance of Inventory Turnover Ratio
- Keeps an eye on the Efficiency of the Company: If the ratio is high it implies that the company is efficient in selling what it is producing but if the ratio is low, then it could point out to overstocking situation or an inefficient sales and marketing effort. Further, it may even signal obsolescence.
- Comparative Analysis: The peer group analysis may tell whether the company is managing the inventory efficiently or not so efficiently in comparison to its competitors. A lower ratio would tell that the company is not doing something right and can help in identifying why the profits of the company are lower than expected.
- Time Series Analysis: If the company’s ITR suddenly starts to decline, it could tell that the company needs to upgrade its product line or range because the consumers are not buying the product as they were before. It could also signal that market research is in order to review the competitive landscape because there might be a better product in the market launched by a competitor that has captured some of the company’s market.
Advantages and Disadvantages of Inventory Turnover Ratio
Below are the points on the Advantages and disadvantages:
Advantages
- Forecasting: It can be used to monitor whether or not a company will meet its budgeted target as it can help in monitoring the during-the-year ratio and help in formulating strategies for the residual year to achieve the desired results. This helps in executing the planning in a better manner that gives higher results.
- Attract investors: This is a key metric that is presented to the prospective investors so that they can make a sound investing decision. This, in turn, leads to gaining a comparative advantage in the industry because once investors are convinced, it is very hard for them to switch to another quickly. However, this doesn’t mean that it is a duping mechanism. The investors are not laypeople and if a company projects a very high ITR as compared to the peers, then that is an indication of foul play.
Disadvantages
- Could be Manipulated: By using the inventory assumption of FIFO or LIFO as the case may be. For example, to reduce the tax payable, a company may prefer using LIFO assumption which would lead to recognizing a higher COGS in the income statement, in a rising price environment and also lead to a lower inventory on the balance sheet. This could lead to a higher ITR which in fact may be misleading
- Comparability of the ITR across a peer group can’t be executed by just taking the numbers out of the financial statements of these companies. A deeper look into the notes of the same is required because two companies may use a different inventory assumption so both need to be brought on the same page before comparing. Therefore ITR in isolation doesn’t tell as much as it is advocated in the financial analysis industry
Conclusion
To resolve the flaw arising due to the inventory assumption, some companies use the number of units method to calculate the ITR instead of the monetary value of the same. The number of units can’t be manipulated as can the monetary value be and therefore, this would give a more accurate ITR which is comparison ready.
Overall, ITR is a useful method to evaluate how well the inventory is being managed by a company and what it could do better in this area to improve its profitability.
Recommended Articles
This is a guide to the Inventory Turnover Ratio. Here we discuss how to calculate along with practical examples. We also provide a downloadable excel template. You may also look at the following articles to learn more –


