Definition of Ratio Analysis
Ratio analysis is a quantitative process that uses comparison ratios to determine the financial well-being of a business. Using ratio analysis, we can learn more about a company’s liquidity, profitability, efficiency, and solvency by looking at its essential financial measures.
A ratio means comparing the line items (financial metrics) present on the company’s financial statements to identify and understand the relation between them. It is basically like viewing a company’s report card. When you get your report card from school, you can see your grades and determine how well you did in different subjects. Similarly, by looking at various ratios of a company, we can see how well it is doing in different areas.
A ratio represents the relation between two or more financial metrics of a company by comparing the line items on its financial statements. For instance, the debt-to-equity ratio describes the connection between the firm’s debt and equity, which is available on its balance sheet. Learning ratio analysis types can simplify your understanding of how to calculate and interpret various ratios.
This comprehensive article covers all the types and subtypes of ratio analysis using simple numerical examples and real-world case studies of Apple, Amazon, Paypal, and Walt Disney.
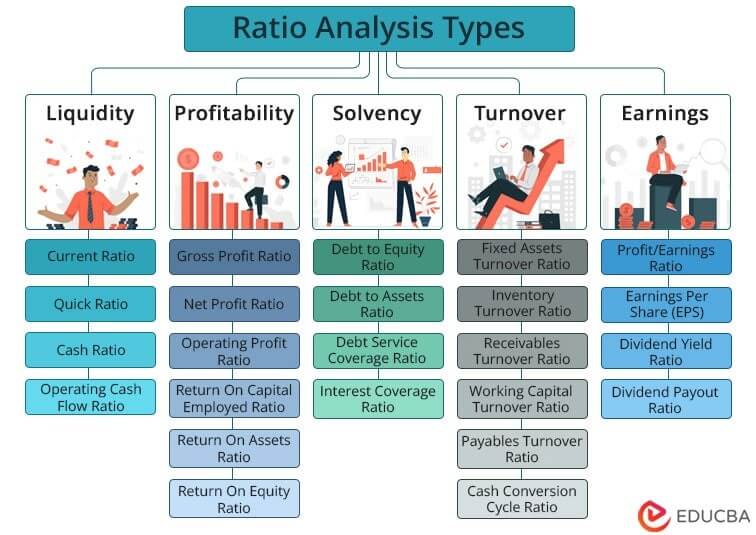
Types of Ratio Analysis
We will discuss the 5 main categories of ratios along with their 24 subtypes below. We have also created an Excel template with a detailed calculator for all the ratios. You can use the following template to practice anytime you want.
1. Liquidity Ratios
Liquidity ratios can help you measure a company’s ability to handle its short-term debt obligations. A higher ratio percentage means that the company is highly rich in cash.
The types of liquidity ratios are:
A) Current Ratio
It evaluates the relationship between a company’s current assets and liabilities. It indicates the liquidity of an organization in being able to meet its debt obligations in the upcoming twelve months. A good ratio should be between 1.2 to 3.
Example & Interpretation:
Let’s find the current ratio for 2022 and 2023 for a hypothetical firm, Starlane Ltd., and interpret the ratio’s values. Suppose it has the following financial data for 2022 and 2023:
|
2022 |
2023 |
| Current Assets = $570,000 | Current Assets = $700,0000 |
| Current Liabilities = $700,000 | Current Liabilities = $530,000 |
Current ratio in 2022 = $570,000 / $700,000 = 0.81
Current ratio in 2023 = $700,000 / 530,000 = 1.32
1. High Current Ratio
Starlane Ltd. had a ratio of 1.32 in 2023, which is higher than 1.2, indicating that the company is highly capable of repaying its short-term debt obligations.
2. Low Current Ratio
As Starlane Ltd. had a ratio of 0.81 in 2022, which is lower than 1.2, it may have difficulty repaying its short-term debt obligations.
Current Ratio of Apple
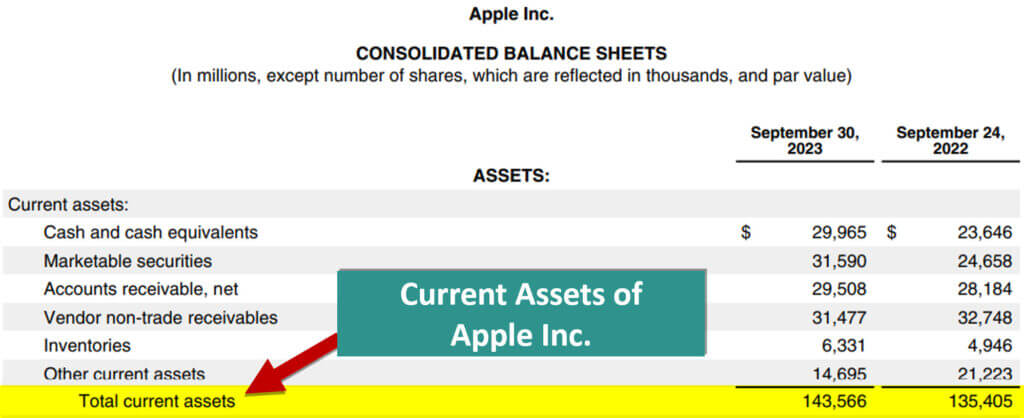
Let us determine the current ratio of Apple Inc for 2023. We get the following financials from Apple’s annual report.
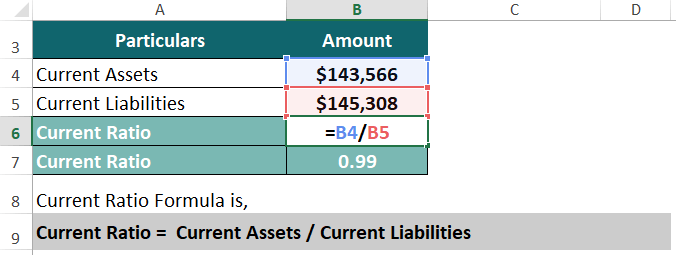
Current Ratio = Current Assets / Current Liabilities
= $143,566 / $145,308 = 0.99
With a ratio of 0.99, Apple had lower liquidity in 2023, meaning it may not have been able to pay its short-term debt using liquid assets. However, companies do use other sources to repay their liabilities. Thus, it does not mean that Apple has poor debt management.
B) Quick Ratio
OR
This ratio helps businesses ascertain information about the capability of a company to pay off its current liabilities on an immediate basis. A company has a good ratio when the value is above 1.
Example & Interpretation:
Calculate and interpret the quick ratio for an imaginary company, Marks & Co., using the following financial data for 2022 and 2023:
|
2022 |
2023 |
| Current Assets = $250,000 | Cash and Cash Equivalents = 39,000 |
| Inventories = 20,000 | Marketable Securities = 34,000 |
| Current Liabilities = $200,000 | Accounts Receivables = 26,000 |
| Current Liabilities = $140,000 |
Quick ratio in 2022 = (Current Assets – Inventories) / Current Liabilities
= ($250,000 – $20,000 )/ $200,000 = 1.15
Quick ratio in 2023 = (Cash and Cash Equivalents + Marketable Securities + Accounts Receivables) / Current Liabilities
= ($39,000 + $34,000 + $26,000) / $140,000 = 0.7
1. High Quick Ratio
As Marks & Co. had a higher ratio than 1 (1.15) in 2022, it had enough liquid assets to fulfill its debt obligations.
2. Low Quick Ratio
Marks & Co. had a lower ratio than 1 (0.7) in 2023, indicating the company had insufficient quick assets to repay its debt in that financial year.
Quick Ratio of Amazon
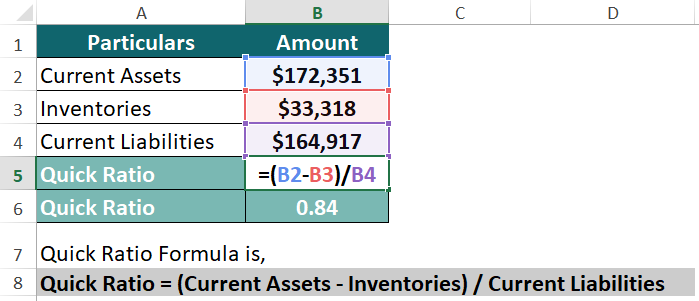
Let us determine the quick ratio of Amazon Inc for 2023. We get the following financials from Amazon’s annual report.
Quick Ratio = (Current Assets – Inventories) / Current Liabilities
= ($172,351 – $33,318) / $164,917 = 0.84
Amazon Inc had a quick ratio of 0.84 in 2023, indicating that it has slightly lower liquidity and, thus, relatively lower chances of repaying debts using quick assets. However, it can use other assets or sources to fulfill its debt obligations.
C) Cash Ratio
It determines if the company can repay its short-term debt using cash, cash equivalents, or marketable securities. A ratio of 0.5 or above is good.
Example & Interpretation:
Compute the cash ratio for both years and interpret the results using the following data for a hypothetical firm: Step-up Ltd.
| 2022 | 2023 |
| Cash + Cash Equivalents = $67,000 | Cash + Cash Equivalents = $49,000 |
| Current Liabilities = $130,000 | Current Liabilities = $150,000 |
Cash ratio in 2022 = $67,000 / $130,000 = 0.51
Cash ratio in 2023 = $49,000 / $150,000 = 0.33
1. High Cash Ratio
As Step-up Ltd. had a higher ratio than 0.5 in 2022, it could repay at least 0.51, i.e., 51% of its liabilities using cash and cash equivalents. However, it also means the company had a poor capital management system.
2. Low Cash Ratio
Step-up Ltd. had a lower ratio than 0.5 (0.33) in 2023, signifying that the company had inadequate liquid cash to fulfill its total debt obligations. However, it also indicates that the company had better capital management.
Cash Ratio of Paypal Holdings
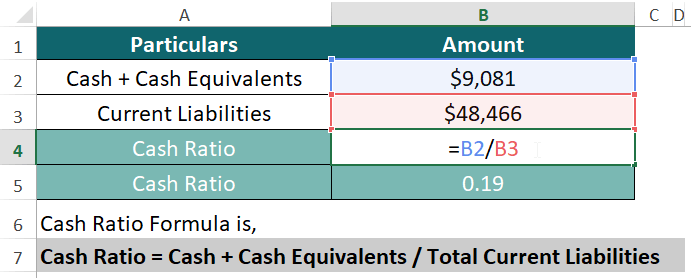
Let us determine the cash ratio of Paypal Holdings for 2023. We get the following financials from Paypal’s annual report.
Cash Ratio = Cash + Cash equivalents / Current Liabilities
= $9,081 / $48,466 = 0.19
Paypal Holdings’ cash ratio of 0.19 (less than 0.5) signifies that if the company uses all of its cash and cash equivalents, it can pay 19% of its total short-term debt using only cash and cash equivalents.
D) Operating Cash Flow Ratio
It calculates how often a company can pay its debt using the cash it generates in a single period. A ratio of 1 or above is favorable for businesses.
Example & Interpretation:
Let us calculate an imaginary firm, Amplework Ltd’s operating cash flow ratio and analyze it. Here is the company’s financial data:
| 2022 | 2023 |
| Cash from operations = $33,000 | Cash from operations = $56,000 |
| Current Liabilities = $100,000 | Current Liabilities = $49,000 |
Operating Cash Flow ratio in 2022 = $33,000 / $100,000 = 0.34
Operating Cash Flow ratio in 2023 = $56,000 / $49,000 = 1.14
1. High Operating Cash Flow Ratio
As Amplework Ltd. had a ratio of 1.14 (higher than 1) in 2023, it could quickly fulfill its debt obligations using its cash flow from operations.
2. Low Operating Cash Flow Ratio
As Amplework Ltd. had a ratio of 0.34 (lower than 1) in 2022, its cash flow from operations cannot cover its liabilities. The company must generate extra income from financing and investing activities to fulfill debt obligations.
Operating Cash Flow Ratio of Walt Disney Co.
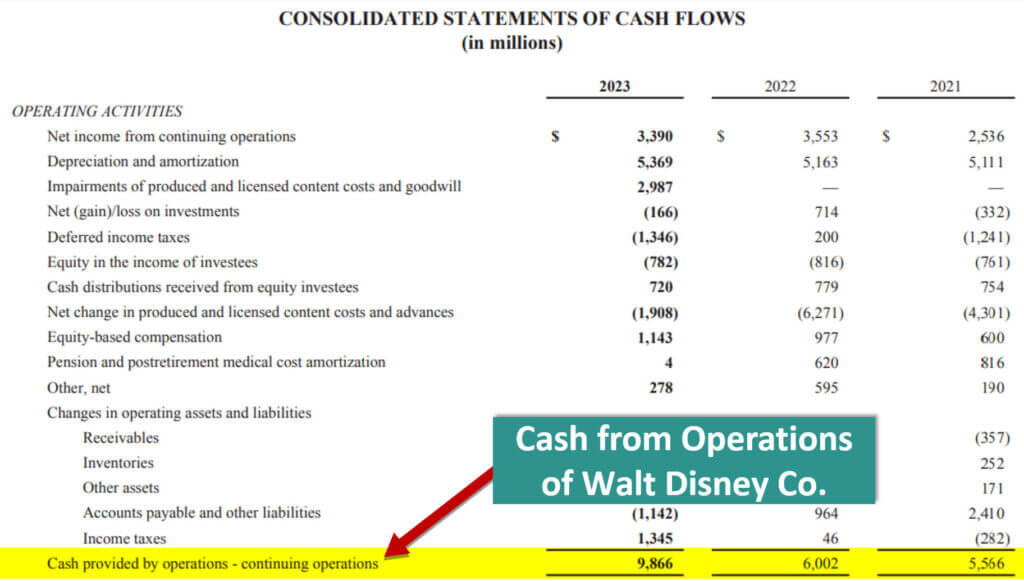
Let us determine the operating cash flow ratio of Walt Disney Co for 2023. We get the following financials from its consolidated balance sheet and cash flow statement from the annual report.
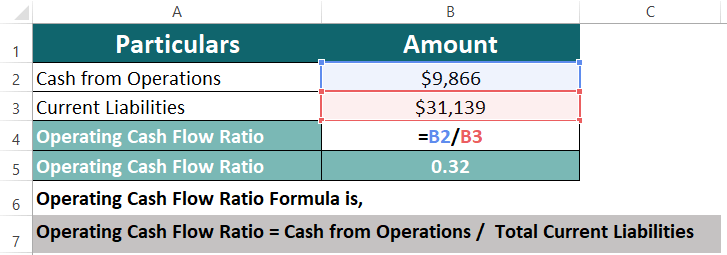
Operating Cash Flow Ratio = Cash from operations / Total current liabilities
= $9,866 / $31,139 = 0.32
An operating cash flow ratio of 0.32 is less than 1, indicating that Walt Disney is generating less cash (32%) than it must generate to pay all its liabilities. Nonetheless, the firm can utilize money from non-operating sources to pay the debts in such cases.
2. Profitability Ratios
This ratio helps measure a company’s ability to earn sufficient profits.
The types of profitability ratios are:
A) Gross Profit Margin Ratio
It represents the operating profits of an organization after making necessary adjustments to the COGS or cost of goods sold. It helps firms ascertain their efficiency in converting finished goods and incurred labor into profit. A good ratio should be 20% or higher.
Example & Interpretation:
Determine the gross profit ratio for the hypothetical company South & West Ltd. and interpret the ratio. Below are the financials of the company:
| 2022 | 2023 |
| Gross Profit = $120,000 | Gross Profit = $170,000 |
| Net Sales = $750,000 | Net Sales = $590,000 |
Gross Profit Ratio in 2022 = ($120,000 / $750,000) * 100 = 16%
Gross Profit Ratio in 2023 = ($170,000 / $590,000) * 100 = 28.8%
1. High Gross Profit Margin Ratio
As South & West Ltd. had a higher ratio than 20% in 2023, it indicates good profitability and generated 28.8% income on 100% of its sales.
2. Low Gross Profit Margin Ratio
South & West Ltd. had a lower ratio than 20% in 2022, indicating lower profitability. It generated only 16% in profit on its total sales.
Gross Profit Margin Ratio of Apple Inc.
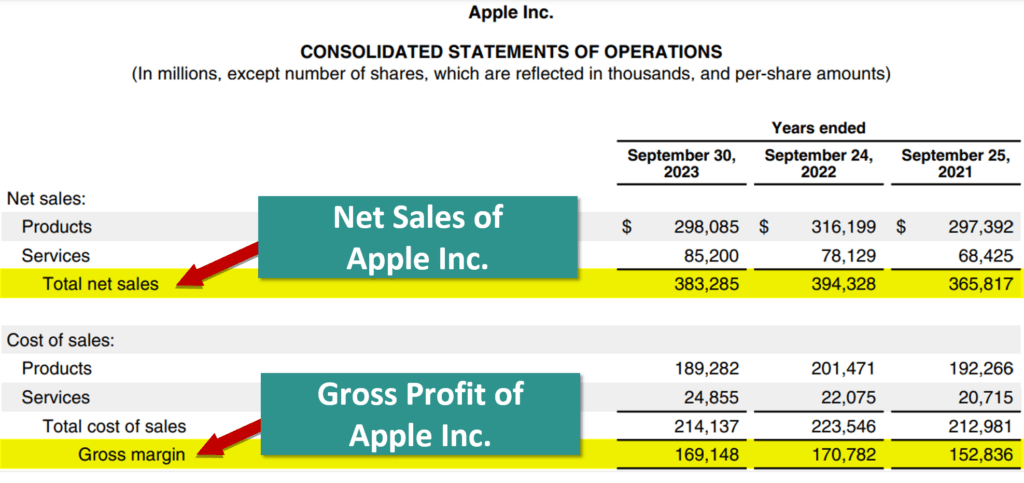
Let us determine the gross profit ratio of Apple Inc for 2023. We get the following financials from Apple’s annual report.
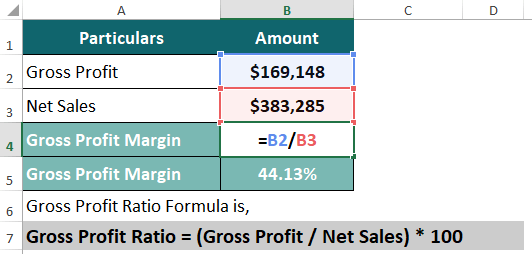
Gross Profit Ratio = (Gross Profit / Net Sales) * 100
= ($169,148 / $383,285) * 100 = 44.13%
Apple’s gross profit ratio of 44.13% indicates that the company is highly profitable and generates $44.13 as profit on each product it sells for $100.
B) Net Profit Ratio
Net profit ratios determine the overall profitability of an organization after reducing both cash and non-cash expenditures. An excellent net profit should be equal to or higher than 10%.
Example & Interpretation:
Let us find the net profit ratio for Lorris & Co. and interpret its meaning. Find the details of the company below:
|
2022 |
2023 |
| Net Profit = $30,000 | Net Profit = $80,000 |
| Net Sales = $550,000 | Net Sales = $620,000 |
Net Profit Ratio in 2022 = ($30,000 / $550,000) * 100 = 5.45%
Net Profit Ratio in 2023 = ($80,000 / $620,000) * 100 = 12.9%
1. High Net Profit Ratio
Lorris & Co. had a higher ratio than 10% (12.9%) in 2023, meaning the firm made $12.9 on every $100 product it sold after deducting all the costs and expenses. It is a considerably good value for the company.
2. Low Net Profit Ratio
Lorris & Co. had a lower ratio than 10% (5.45%) in 2022. So after deducting all costs, the company only makes $5.45 on each $100 product they sell. It is not a very profitable value for the business.
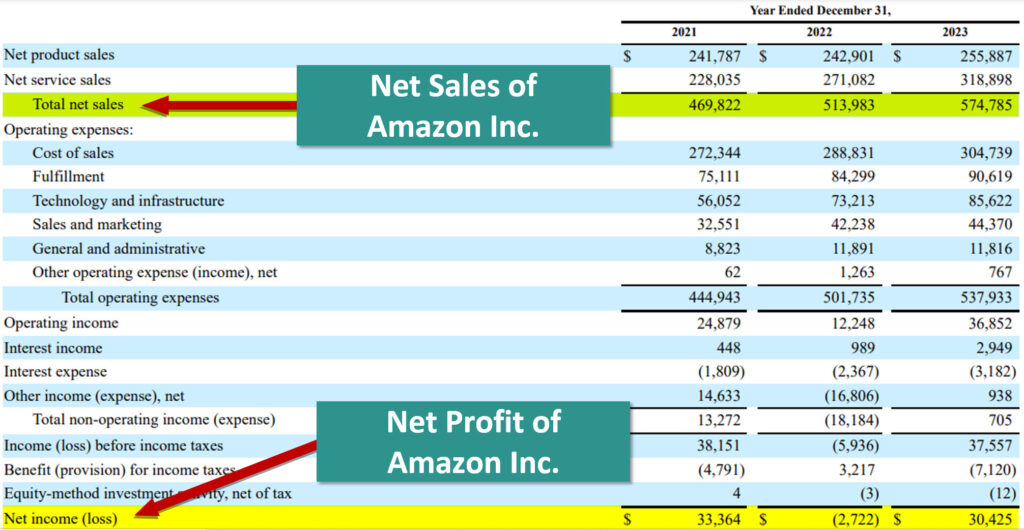
Net Profit Ratio of Amazon Inc.
Let us determine the net profit ratio of Amazon Inc for 2023. We get the following financials from Amazon’s annual report.
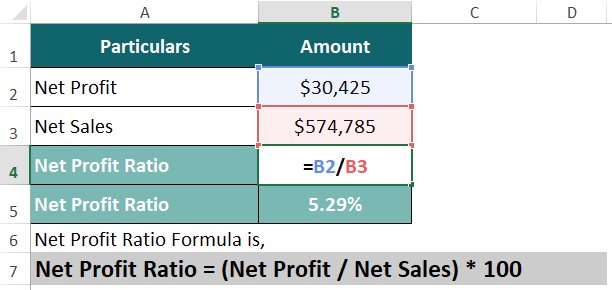
Net Profit Ratio = (Net Profit / Net Sales) * 100
= ($30,425 / $574,785) * 100 = 5.29%
Amazon Inc. has a net profit ratio of 5.29% in 2023. It shows their profit margin is more than the industry average of 5%, indicating an opportunity to refine their pricing strategy and enhance profitability.
C) Operating Profit Ratio
It can help us ascertain the organization’s profits and financial ability to repay all short-term and long-term debt obligations. A good ratio should be 10% or above.
Example & Interpretation:
Let us determine the operating profit ratio for Globex Corp. and interpret its resulting ratio. Below is the table with the company’s financial information for 2022 and 2023.
| 2022 | 2023 |
| EBIT = $25,000 | EBIT = $13,000 |
| Net Sales = $135,000 | Net Sales = $150,000 |
Operating Profit Ratio in 2022 = ($25,000 / $135,000) * 100 = 18.5%
Operating Profit Ratio in 2023 = ($13,000 / $150,000) * 100 = 8.67%
1. High Operating Profit Ratio
Globex Corp. had a higher ratio than 10% in 2022, indicating higher profitability and 18.5% of its total revenue is its operating profit.
2. Low Operating Profit Ratio
As Globex Corp. had a lower ratio than 10% in 2023, it means that it had lower profitability, and only 8.67% of its revenue was operating profit.
D) Return on Capital Employed (ROCE)
It determines an organization’s profitability concerning the capital invested in the business. A business with a 20% or more ratio value is profitable.
Example & Interpretation:
Let us calculate the ROCE of Nesham Ltd. for 2022 and 2023 and interpret the results. Below are the financials of the company:
| 2022 | 2023 |
| EBIT = $15,000 | EBIT = $25,000 |
| Capital Employed = $125,000 | Capital Employed = $115,000 |
Return on Capital Employed Ratio in 2022 = ($15,000 / $125,000) * 100 = 12%
Return on Capital Employed Ratio in 2023 = ($25,000 / $115,000) * 100 = 21.7%
1. High Return on Capital Employed Ratio
As Nesham Ltd. had a higher ratio than 20% in 2023, the 21.7% ratio signifies that it uses its employed capital effectively to generate enough profits.
2. Low Return on Capital Employed Ratio
As Nesham Ltd. had a lower ratio than 20% in 2022, the 12% ratio signifies that it cannot generate enough profits from its employed business capital.
E) Return on Assets (ROA)
It calculates the efficiency of a business employing its total assets to generate profits. A good ROA ratio to have is 5% and higher.
Example & Interpretation:
Calculate Asten & Co’s return on assets ratio and interpret the results of the ratio. Below is a table with Asten & Co’s financial data for 2022 and 2023:
| 2022 | 2023 |
| Net Income = $12,000 | Net Income = $17,000 |
| Total Assets = $300,000 | Total Assets = $320,000 |
Return on Assets Ratio in 2022 = ($12,000 / $300,000) * 100 = 4%
Return on Assets Ratio in 2023 = ($17,000 / $320,000) * 100 = 5.3%
1. High Return on Assets Ratio
Asten & Co. had a higher ratio than 5% (5.3%) in 2023, indicating that the business had reliable asset management and was generating good profits with smaller investments.
2. Low Return on Assets Ratio
Asten & Co. had a lower ratio than 5% (4%) in 2022, signifying that the company could not generate enough profits from current asset investments and thus had poor asset management.
F) Return on Equity (ROE)
It determines how well a company uses its shareholders’ capital to generate profits. While a ratio of 15% to 20% is good, the higher the ratio, the better.
Example & Interpretation:
Let us interpret the profitability of Lorens Lane Ltd. by calculating its return on equity ratio. The company’s data for 2022 and 2023 are given in the table below:
|
2022 |
2023 |
| Net Income = $20,000 | Net Income = $12,000 |
| Shareholders Equity = $100,000 | Shareholders Equity = $140,000 |
Return on Equity Ratio in 2022 = ($20,000 / $100,000) * 100 = 20%
Return on Equity Ratio in 2023 = ($12,000 / $140,000) * 100 = 8.5%
1. High Return on Equity Ratio
As Lorens Lane Ltd. had a ratio higher than 15% in 2022, it indicates that the business could generate a good level of profit (20%) using its shareholder’s invested capital.
2. Low Return on Equity Ratio
As Lorens Lane Ltd. had a ratio lower than 15% in 2023, the company did not use the shareholder’s invested money effectively. It thus generated lower profits (8.5%).
3. Solvency Ratios
Solvency ratio is a type of ratio that evaluates whether a company is solvent and well capable of paying off its debt obligations or not.
The types of solvency ratios are:
A) Debt-Equity Ratio
The debt-equity ratio is the ratio between total debt and shareholders’ funds. It calculates the leverage of an organization. An ideal ratio for an organization is 2:1.
Example & Interpretation:
Compute the debt-equity ratio for Ramp-up Ltd. using the given data for 2022 and 2023 and interpret the resulting ratios.
|
2022 |
2023 |
| Total Liabilities = $250,000 | Total Liabilities = $150,000 |
| Shareholders Equity = $90,000 | Shareholders Equity = $80,000 |
Debt-Equity ratio in 2022 = $250,000 / $90,000 = 2.7
Debt-Equity ratio in 2023 = $150,000 / $80,000 = 1.87
1. High Debt-Equity Ratio
As Ramp-up Ltd. had a ratio of 2.7 in 2022, which is higher than 2, it was using more debt (borrowings from the market) than equity to run its business operations, which can be risky, as per investors.
2. Low Debt-Equity Ratio
As Ramp-up Ltd. had a ratio of 1.87 in 2023, which was lower than 2, it started using less debt for funding its business and is less risky. However, the ratio should not fall below 1, as it can mean the firm has higher liabilities which is not a good sign.
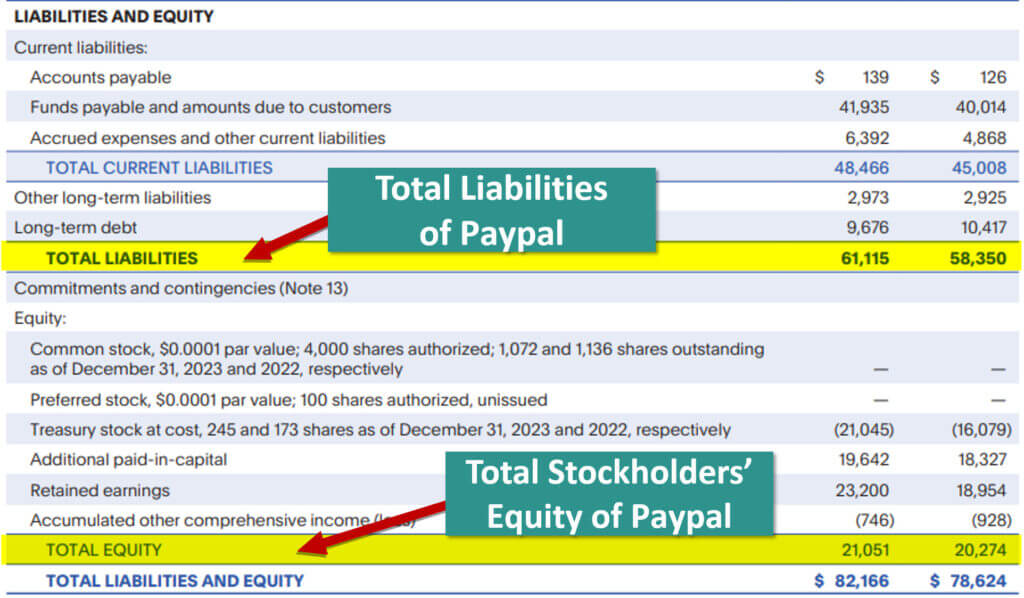
Debt-Equity Ratio of Paypal Holdings
Let us determine the Debt-Equity ratio of Paypal Holdings for 2023. We can find the financial data from Paypal’s annual report.
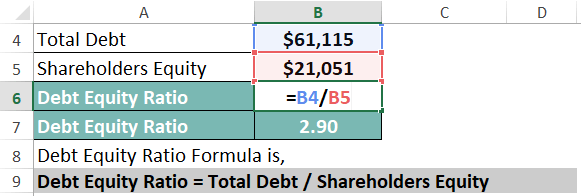
Debt-Equity Ratio = Total Liabilities / Shareholders Equity
= $61,115 / $21,051 = 2.90
Paypal Holdings’ debt-to-equity ratio is 2.90, which is higher than the average ratio of 2:1. It indicates that the company uses more debt than equity to fund its operations.
B) Debt to Assets
It computes how much debt a company uses to fund its assets and business. An ideal Debt to Asset ratio is a ratio lower than 1.
Example & Interpretation:
Determine the debt-to-assets ratio for Holy & Poly Ltd. and analyze it. Following is the company’s financial data for 2022 and 2023:
|
2022 |
2023 |
| Total Debt = $168,000 | Total Debt = $125,000 |
| Total Assets = $130,000 | Total Assets = $180,000 |
Debt to Assets ratio in 2022 = $168,000 / $130,000 = 1.29
Debt to Assets ratio in 2023 = $125,000 / $180,000 = 0.69
1. High Debt to Assets Ratio
Holy & Poly Ltd. had a higher ratio than 1 (1.29) in 2022, indicating that the company has been using more debt to finance its assets, making it a riskier investment for investors.
2. Low Debt to Assets Ratio
Holy & Poly Ltd. had a lower ratio than 1 (0.69) in 2023, indicating that the company uses lesser debt to fund its assets, making it a favorable option for investors.
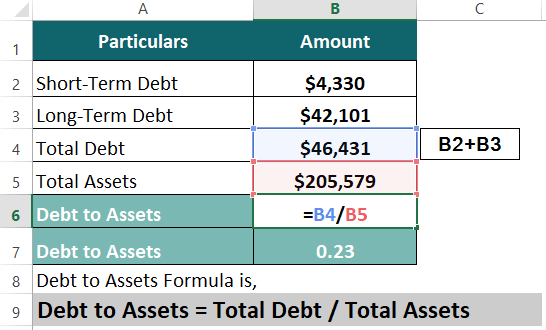
Debt to Assets Ratio of Walt Disney Co.
Let us determine the debt-to-assets ratio of Walt Disney Co for 2023. We find its financials from Walt Disney’s annual report.
Debt to Assets Ratio = Total Debt / Total Assets
= ($4,330 + $42,101) / $205,579 = 46,431 / 205,579 = 0.23
Walt Disney had a debt-to-assets ratio of 0.23 in 2023. Less than 1 indicates that the company has a higher leverage and uses only 23% of its debt to fund its assets. Thus, it maintains an excellent financial position.
C) Debt Service Coverage Ratio (DSCR)
It determines if the firm can generate enough cash flow in an accounting period to fulfill its debt obligations, including interests and principles. A good DSCR ratio is a value of 1.2 or higher.
Example & Interpretation:
Let us calculate the debt service coverage ratio of Parks In Ltd. for 2022 and 2023 and analyze the ratio. Their financial information is in the table below:
|
2022 |
2023 |
| Net Operating Income = $100,000 | Net Operating Income = $130,000 |
| Debt Service = $92,000 | Debt Service = $80,000 |
Debt Service Coverage ratio in 2022 = $100,000 / $92,000 = 1.08
Debt Service Coverage ratio in 2023 = $130,000 / $80,000 = 1.62
1. High Debt Service Coverage Ratio
Parks In Ltd. had a ratio higher than 1.2 (1.62) in 2023, which signifies that the business had enough cash flow to fulfill its debt obligations and did not need borrowings to cover its liabilities.
2. Low Debt Service Coverage Ratio
Parks In Ltd. had a ratio lower than 1.2 (1.08) in 2022, signifying it lacks enough cash flow. Thus, the company may need to borrow money from outside sources to cover all of its pending debt.
D) Interest Coverage Ratio
The interest coverage ratio determines the solvency of an organization in the short-term future. It calculates the number of times an organization’s profits can cover its interest-related expenses. A good interest coverage ratio should be 1.5 or above.
Example & Interpretation:
Compute the interest coverage ratio of Wendy & Co. for 2022 and 2023. Also, analyze the results and interpret the ratio. The company’s financial data is as follows:
|
2022 |
2023 |
| EBITDA = $100,000 | EBITDA = $140,000 |
| Interest Expense = $85,000 | Interest Expense = $85,000 |
Interest Coverage ratio in 2022 = $100,000 / $85,000 = 1.17
Interest Coverage ratio in 2023 = $140,000 / $85,000 = 1.64
1. High Interest Coverage Ratio
Wendy & Co. had a higher ratio than 1.5 in 2023. The percentage of 1.64 means the company could quickly pay the interest expenses on its debts using its profits. Thus, the firm has higher solvency.
2. Low Interest Coverage Ratio
Wendy & Co. had a lower ratio than 1.5 in 2022. A ratio of 1.17 means that the firm had fewer profits and couldn’t cover its interest, and stands a higher possibility of going bankrupt.
4. Turnover Ratios
Turnover ratios determine how efficiently an organization’s financial assets and liabilities have been used to generate revenues.
The types of turnover ratios are:
A) Fixed Assets Turnover Ratio
It determines the efficiency of an organization in utilizing its fixed assets to generate revenues. An ideal ratio value is 1.5 or more. However, it differs from industry to industry.
Example & Interpretation:
Find the fixed assets turnover ratio of Marshall Corp and interpret its results for 2022 and 2023. The financial information of the company is in the table below:
| 2022 | 2023 |
| Net Sales = $300,000 | Net Sales = $375,000 |
| Average Fixed Assets = $225,000 | Average Fixed Assets = $200,000 |
Fixed Assets Turnover Ratio in 2022 = ($300,000 / $225,000) = 1.33
Fixed Assets Turnover Ratio in 2023 = ($375,000 / $200,000) = 1.87
1. High Fixed Assets Turnover Ratio
In 2023, Marshall Corp had a ratio of 1.87, which is higher than 1.5, indicating that the company could generate enough sales by utilizing its fixed assets (building, equipment, etc.).
2. Low Fixed Assets Turnover Ratio
In 2022, Marshall Corp had a ratio of 1.33, which is lower than 1.5, indicating that the firm couldn’t generate enough sales by employing its fixed assets. Thus, it had poor asset management.
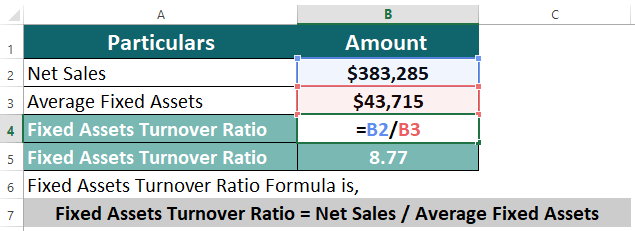
Fixed Assets Turnover Ratio of Apple Inc.
Let us determine the fixed assets turnover ratio of Apple Inc for 2023. We get the following financials from Apple’s annual report.
Fixed Assets Turnover Ratio = Net Sales / Average Fixed Assets
= $383,285 / $43,715 = 8.77
Apple had a fixed assets turnover ratio of 8.77 in 2023, which is higher than the IT industry’s ideal fixed asset turnover ratio. Thus, it signifies that the company has solid asset management and is generating substantially higher profits using its fixed assets.
B) Inventory Turnover Ratio
The inventory turnover ratio determines a company’s speed in converting its inventories into sales. A company should have an inventory turnover ratio of between 5 to 10.
Example & Interpretation:
Let us find the inventory turnover ratio for Markwood Ltd. and interpret its meaning. Find the details of the company below:
| 2022 | 2023 |
| Cost of Goods Sold = $420,000 | Cost of Goods Sold = $380,000 |
| Average Inventories = $80,000 | Average Inventories = $120,000 |
Inventory Turnover Ratio in 2022 = ($420,000 / $80,000) = 5.25
Inventory Turnover Ratio in 2023 = ($380,000 / $120,000) = 3.16
1. High Inventory Turnover Ratio
As Markwood Ltd. had a higher ratio than 5 (5.25) in 2022, the firm had a good sales turnover, and the product had a high market demand.
2. Low Inventory Turnover Ratio
As Markwood Ltd. had a lower ratio than 5 (3.16) in 2023, the firm cannot convert its inventory into sales as much as it should. It may also happen due to the product’s poor market demand.
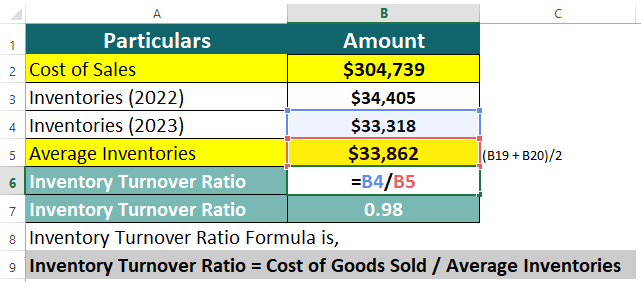
Inventory Turnover Ratio of Amazon Inc.
Let us determine the inventory turnover ratio of Amazon Inc for 2023. We get the following financials from Amazon’s annual report.
Inventory Turnover Ratio = Cost of Goods Sold / Average Inventories
= $304,739 / (($34,405 + $33,318) / 2)
= $272,344 / 33,862 = 0.98
Amazon’s inventory turnover ratio of 0.98 in 2023 shows that the firm may have lower than usual efficiency in converting inventory into sales. They can increase their ratio by cutting costs, reducing inventory volume, increasing product demand, or pricing their products effectively.
C) Receivable Turnover Ratio
It calculates the average number of times a firm collects its account receivables to determine its efficiency. Typically, a firm should collect its receivables at least once a year (ratio = 1).
Example & Interpretation:
Calculate Cindylane Ltd’s receivable turnover ratio for 2022 and 2023 using the data given below:
| 2022 | 2023 |
| Net Credit Sales = $92,000 | Net Credit Sales = $230,000 |
| Average Account Receivables= $110,000 | Average Account Receivables = $115,000 |
Receivable Turnover Ratio in 2022 = ($92,000 / $110,000) = 0.84
Receivable Turnover Ratio in 2023 = ($230,000 / $115,000) = 2
1. High Receivable Turnover Ratio
As Cindylane Ltd. had a ratio higher than 1 in 2023, the firm could collect all its receivables 2 times in one accounting period.
2. Low Receivable Turnover Ratio
Cindylane Ltd. had a lower ratio than 1 in 2022. The firm had weak credit policies, poor credit collection techniques, etc. It could not collect all its receivables even once in a financial year (ratio =0.84).
D) Working Capital Turnover Ratio
It effectively measures how efficiently a business uses its working capital to generate sales. A good working capital ratio should fall between 1.5 to 2.5.
Example & Interpretation:
Let us find the working capital turnover ratio for 2021, 2022, and 2023 of company Driven & Co. We will also interpret the results and describe what they mean. Details of the company are in the table below:
| 2021 | 2022 | 2023 |
| Turnover = $290,000 | Turnover = $450,000 | Turnover = $330,000 |
| Working Capital = $280,000 | Working Capital = $170,000 | Working Capital = $180,000 |
Working Capital Turnover Ratio in 2021 = ($290,000 / $280,000) = 1.03
Working Capital Turnover Ratio in 2022 = ($450,000 / $170,000) = 2.64
Working Capital Turnover Ratio in 2023 = ($330,000 / $180,000) = 1.83
1. High Working Capital Turnover Ratio
As Driven & Co. had a higher ratio than 2.5 in 2022, the ratio of 2.64 indicates that the company uses most of its working capital to generate sales. Thus, the company cannot use its current working capital to invest in future growth projects.
2. Low Working Capital Turnover Ratio
As Driven & Co. had a lower ratio than 1.5 in 2021, the ratio of 1.03 indicates that the firm is not generating sales using its working capital and may even face liquidity issues in the short term.
3. Good Working Capital Turnover Ratio
As Driven & Co. had a ratio between 1.5 and 2.5 in 2023, the ratio of 1.83 indicates that the business is efficiently using its working capital to generate sales and has enough to fund its future growth prospects.
E) Payables Turnover Ratio
It is a ratio that computes the number of times a business pays its accounts payables in a single accounting period. A good value for this ratio falls between 6 to 10, or it can be higher too.
Example & Interpretation:
Let us find the company Vennwood Corp’s payables turnover ratio and interpret its resulting ratios for 2022 and 2023. The below table contains the details of the company:
| 2022 | 2023 |
| Purchases = $450,000 | Purchases = $570,000 |
| Accounts Payable = $100,000 | Accounts Payable = $80,000 |
Payables Turnover Ratio in 2022 = ($450,000 / $100,000) = 4.5
Payables Turnover Ratio in 2023 = ($570,000 / $80,000) = 7.125
1. High Payables Turnover Ratio
As Vennwood Corp had a higher ratio than 6 (7.125) in 2023, the firm was able to pay its dues and debts regularly, creating a good relationship with suppliers and creditors.
2. Low Payables Turnover Ratio
As Vennwood Corp had a lower ratio than 6 (4.5) in 2022, the firm could not pay its short-term debts and credit purchases due to inadequate cash flow or poor financial management.
F) Cash Conversion Cycle Ratio
This ratio calculates the total days a business takes to earn back the cash it spent on inventory by selling its products. The benchmark for this ratio is 30-45 days.
Example & Interpretation:
Compute the cash conversion cycle ratio of Jim & Jorge Ltd. for 2022 and 2023. Also, interpret the resulting ratios. The details for the company’s financials are in the table below:
| 2022 | 2023 |
| Days Inventory Outstanding (DIO) = 111.4 | Days Inventory Outstanding (DIO) = 120 |
| Days Sales Outstanding (DSO) = 8.6 | Days Sales Outstanding (DSO) = 15 |
| Days Payable Outstanding (DPO) = 50 | Days Payable Outstanding (DPO) = 101 |
Cash Conversion Cycle Ratio in 2022 = 111.4 + 8.6 – 50 = 70
Cash Conversion Cycle Ratio in 2023 = 120 + 15 – 101 = 34
1. High Cash Conversion Cycle Ratio
As Jim & Jorge Ltd. had a higher ratio than 45 days in 2022, it indicates that it took the firm 70 days to earn the amount of money it spent on making an inventory. Thus, it has lesser control over its working capital.
2. Low Cash Conversion Cycle Ratio
As Jim & Jorge Ltd. had a lower ratio than 45 days in 2023, it indicates that it could efficiently convert its inventory into sales and collect the equivalent or more of what it spent on the inventory in 34 days. It gives the company better liquidity and adequate working capital for its business.
5. Earnings Ratios
Earnings ratios determine the returns that an organization generates for its investors.
The types of earnings ratios are:
A) Profit/Earnings Ratio
The P/E ratio helps determine if a stock’s value is underpriced or overpriced by calculating the price of its share as per its earnings per share. Ideally, a good P/E ratio should be below 20.
Example & Interpretation:
Using the data, compute the profit-to-earnings ratio of RisenMark Ltd. for 2022 and 2023. Also, compare and interpret the resulting ratios.
|
2022 |
2023 |
| Market Price per Share = $60 | Market Price per Share = $50 |
| Earnings per Share = 2.4 | Earnings per Share = 2.63 |
Profit/Earnings ratio in 2022 = $250,000 / 90,000 = 25
Profit/Earnings ratio in 2023 = $150,000 / 80,000 = 19
1. High Profit/Earnings Ratio
As RisenMark Ltd. had a higher ratio than 20 (25) in 2022, each share is overpriced compared to what the company is earning for a single share. It makes the share risky for investors.
2. Low Profit/Earnings Ratio
As RisenMark Ltd. had a lower ratio than 20 (19) in 2023, it means that compared to the profit the company makes on each share, the share’s pricing is accurate or maybe underpriced. It indicates that there are chances that the prices will increase, making it a good investment opportunity.
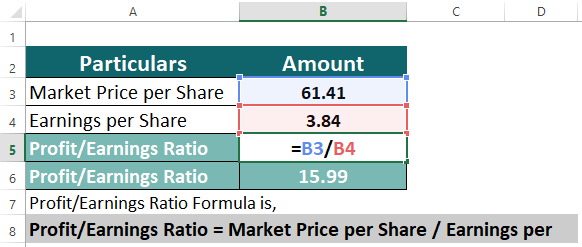
Profit/Earnings Ratio of Paypal Holdings
Let us determine the profits/earnings ratio of Paypal Holdings for 2023. We can find the financial data from Paypal’s annual report.
Profit/Earnings Ratio = Market Price per Share / Earnings per Share
= $61.41 / 3.84 = 15.99.
Paypal Holdings’ had a profit-to-earning ratio of 15.99 in 2023. It shows that the share is undervalued. However, before making any decisions, investors must use other tools like financial analysis, financial modeling, and valuation to arrive at a possible conclusion.
B) Earnings per Share (EPS)
Earnings per share (EPS) computes the value a company generates for each shareholder. There is no ideal ratio for EPS. The higher the ratio, the better. However, we can compare the current ratio value with the previous year to determine if it is doing well.
Example & Interpretation:
Determine the EPS ratio for Lorris & Marks Ltd. and analyze its resulting ratios. Following is the company’s financial information for 2022 and 2023:
|
2022 |
2023 |
| Net Income = $248,000 | Net Income = $100,000 |
| Preferred Dividends = 0 | Preferred Dividends = 0 |
| Weighted Average of Outstanding Shares = 100,000 | Weighted Average of Outstanding Shares = 110,000 |
EPS ratio in 2022 = ($248,000 – 0 ) / $100,000 = 2.48
EPS ratio in 2023 = ($100,000 – 0 ) / $110,000 = 0.9
1. High EPS Ratio
Lorris & Marks Ltd. had a higher ratio than 1 in 2022, indicating that the company is generating higher returns on each of its shares which is good for existing shareholders and new investors. It means that for each $1 that investors invest in this company’s shares, they get a return of $2.48.
2. Low EPS Ratio
Lorris & Marks Ltd. had a lower ratio than 1 in 2023, indicating that the firm could not generate higher profits on its shares. The lower the EPS, the less likely investors are to purchase the stock. It means that for every $1 investor invests in this company’s stocks, they only get $0.9 in return.
EPS Ratio of Walt Disney Co.
Let us determine the EPS ratio of Walt Disney Co for 2023. We find its financials from Walt Disney’s annual report.
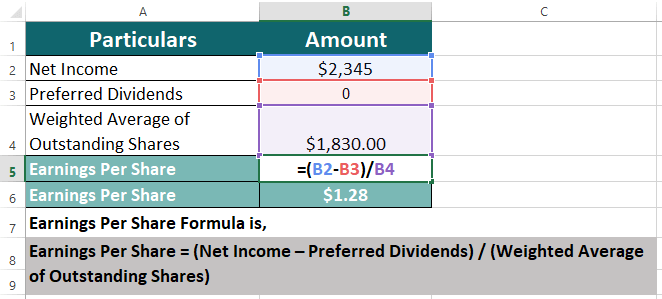
EPS = (Net Income – Preferred Dividends) / (Weighted Average of Outstanding Shares)
= ($2,345 – 0) / 1,830= $1.28
Walt Disney’s EPS for 2023 was $1.28, i.e., it earned $1.28 on every share the company had. Compared to the company’s previous year’s EPS of $1.72, it is a decrease and thus a bad sign for investors.
C) Dividend Yield Ratio
It determines the return an investor or shareholders receives as dividends compared to how much they have invested in the company’s shares. A good dividend yield ratio should be 2% or higher.
Example & Interpretation:
Compute the dividend yield ratio of Osten Company using the details below and interpret the resulting ratios for 2022 and 2023.
| 2022 | 2023 |
| Dividend Per Share = $4.83 | Dividend Per Share = $1.98 |
| Share Price = $105 | Share Price = $110 |
Dividend Yield Ratio in 2022 = ($4.83 / $105) * 100 = 4.6%
Dividend Yield Ratio in 2023 = ($1.98 / $110) * 100 = 1.8%
1. High Dividend Yield Ratio
Osten Company had a higher ratio than 2% in 2022, signifying that the company pays 4.6% of the share price back to the investors as dividends. It makes the stock desirable.
2. Low Dividend Yield Ratio
Osten Company had a lower ratio than 2% in 2023, signifying that the firm is paying them 1.8% of the shareholders’ investments as dividends. It might make the stock undesirable.
D) Dividend Payout Ratio
It calculates the total percentage of income a company uses to pay dividends to its shareholders. An ideal payout ratio for companies is 30% to 50% or lower.
Example & Interpretation:
Compute the dividend payout ratio for Karls & Webber for the year 2022 and 2023. Also, interpret the resulting ratios. The details for the company’s financials are in the table below:
|
2022 |
2023 |
| Total Dividends = $225,000 | Total Dividends = $150,000 |
| Net Income = $370,000 | Net Income = $420,000 |
Dividend Payout Ratio in 2022 = ($225,000 / $370,000) * 100 = 60.8%
Dividend Payout Ratio in 2023 = ($150,000 / $420,000) * 100 = 35.7%
1. High Dividend Payout Ratio
Karls & Webber had a higher ratio than 50% in 2022, meaning that the business is using more than half, 60.8% of its profits, to distribute dividends to its shareholders. Although it may seem preferable, the company may not use most earnings to reinvest in the business, which can restrict its growth.
2. Low Dividend Payout Ratio
Karls & Webber had a lower ratio than 50% in 2023, meaning it is using less than half, which is 35.7% of its earnings, to repay investors through dividends and invest the rest back into the business. It can use the rest to invest in business expansion plans or growth prospects.
Why is Ratio Analysis Important?
Now that we have understood how to calculate each ratio with the help of examples of real companies, we are in a better position to understand their importance. Here are some reasons why ratio analysis is necessary:
- Simplify Financial Aspects: It simplifies the financial information of a business and can help you quickly understand its financial situation.
- Financial Analysis: It makes it possible to assess the performance and health of a company by analyzing its financial position.
- Determine Risks: It helps determine any current or future business and financial risks so you can reduce risk and boost the likelihood of success.
- Utilization of Funds: Companies can analyze ratios to regulate their use of funds to improve their financial performance.
- Planning & Forecasting: Companies can make future projections and forecasts and use them to make plans of action for their businesses.
- Comparisons: It enables investors to compare a company’s financial performance to benchmarks set by the industry or its competitors. Comparisons within the company are also possible.
- Business Decision Making: It can help find trends and patterns to identify a company’s strengths or problems to make knowledgeable choices about financing or investing. It also helps form opinions and make well-informed choices on mergers and acquisitions, investment opportunities, and other business decisions.
Industry-Specific Ratios
Companies in different industries use different kinds of ratios to understand how their firm is performing. Here is a list of common ratios that are useful in specific industries. We have also given examples and each ratio’s interpretation:
| Industry | Ratio | Well-known Companies and Their Ratios (2023) | Performance |
| Technology | Price-to-Earnings Ratio (P/E Ratio) | Apple – 29.95 | Poor |
| Return on Equity | Microsoft – 39.17% | Excellent | |
| Quick Ratio | Alphabet (Google) – 1.9 | Good | |
| Retail | Gross Profit Margin | Walmart – 23.5% | Good |
| Inventory Turnover | Amazon – 9.15 | Good | |
| Return on Assets | Target – 7.6% | Good | |
| Debt-to-Equity Ratio | Costco – 0.26 | Good | |
| Automobile | Inventory Turnover | BMW – 5.79 | Good |
| Return on Investment | Ford – 3.04% | Poor | |
| Debt-to-Equity Ratio | Toyota – 1.04 | Good | |
| Manufacturing | Asset Turnover | General Electric – 0.4 | Poor |
| Return on Investment | Caterpillar – 19.58% | Excellent | |
| Operating Margin | Tesla – 9.37% | Average | |
| Healthcare | Current Ratio | Johnson & Johnson – 1.2 | Average |
| Days in Accounts Receivable | Pfizer – 72.98 | Average | |
| Interest Coverage Ratio | UnitedHealth Group – 10 | Excellent |
Limitations of Specific Ratios
Although ratio analysis is instrumental in a company’s evaluation, specific ratios may be less helpful for different sectors and industries. In this section, we discuss the limitations of particular ratios and provide examples of when they may not be as helpful.
|
Ratio |
Industries in which the ratio may not be useful | Why? |
Alternate Ratios |
| Quick Ratio | Manufacturing & Construction | They invest heavily in fixed assets, like equipment, machinery, and industrial plants. | Current Ratio, Cash Ratio |
| Consulting or Software Development | They have quick assets like accounts receivable which may have varying collection periods. | Quick assets like accounts receivable may have varying collection periods, making it challenging to estimate liquidity accurately. | |
| Operating Cash Flow Ratio | Manufacturing, Infrastructure, and Construction | They invest their operating cash flow into long-term assets like equipment and property instead of having cash on hand. | Debt-to-Equity Ratio, Current Ratio |
| Gross Profit Ratio | Retail | They have a range of pricing strategies like discounts and promotions. So, they might have lower profit margins, even though they sell many products. | Operating Profit Ratio, Net Profit Ratio |
| Construction | The cost of goods sold can vary widely between projects, affecting the accuracy of the ratio. | ||
| ROA Ratio | Service-based industries (consulting, advertising, software development) | They depend more on human capital and intangible assets (intellectual property or brand value) than physical assets. | Return on Invested Capital (ROIC) |
| ROE Ratio | Technology or Pharmaceuticals | They rely heavily on intangible assets as the ratio only factors in the return on equity investment and does not consider the value of these intangible assets. | Return on Capital Employed (ROCE), Gross Profit Ratio |
| Real Estate | The ratio doesn’t consider non-equity financings like mortgages and loans. | ||
| Financial Sector | The ratio only looks at equity investment and doesn’t factor in how debt affects overall profitability. | The ratio doesn’t factor in how debt affects overall profitability. | |
| Interest Coverage Ratio | Software | It has insignificant interest expenses due to less investment in fixed assets. | Debt-to-Equity, DSCR Ratio |
| Biotechnology | They have different financing structures and may not rely on debt to pay their interest expenses. | ||
| Hospitality | It has volatile revenue streams and non-interest expenses that make the ratio less relevant. | Volatile revenue streams and non-interest expenses could make this ratio less relevant. | |
| Working Capital Turnover Ratio | Retail | They have significant inventory turnover, which impacts revenue more than working capital management. | Debt-to-Equity, Fixed Asset Turnover Ratio |
| Biotech | They have long operating cycles and investments in R&D, and working capital is not a key revenue driver. | ||
| Profit/Earnings Ratio | Oil and Gas | They have higher non-cash items like depreciation and amortization. | EBITDA Ratio, Price-to-Cash Flow Ratio |
| Technology | They have more intangible assets like patents and intellectual property that affect earnings. |
Advantages & Disadvantages of Ratio Analysis
|
Advantages |
Disadvantages |
| It gives valuable insights into the business’s financial performance. | Companies can easily manipulate financial data and generate distorted results. |
| Assists firms in identifying trends & patterns in their overall financial health. | It is sometimes an issue to compare ratios across sectors and industries. |
| It is a handy tool for making informed business decisions. | Business environment, needs, and changes can easily impact decisions. Thus decisions based solely on ratios might not be practical. |
Frequently Asked Questions (FAQs)
Q1. What are the limitations of ratio analysis?
Answer: While ratio analysis is a brilliant tool for analyzing and evaluating a company, it only covers the factors like liquidity, profitability, and solvency. It also gives us limited data regarding a company’s financial performance, not considering other significant elements, including managerial quality, market trends, and competitive pressures. Moreover, as every firm is distinct, comparing ratios between businesses with various business structures, strategies, and risk profiles can be deceptive.
Q2. Which tool is useful for ratio analysis?
Answer: Ratio analysis uses the financial statements of a corporation, such as the balance sheet, income statement, and cash flow statement. The information in these financial statements can help calculate several financial ratios. The calculator can be manual, or analysts can use spreadsheet software like Microsoft Excel. Alternatively, several financial analysis tools and programs can automate the ratio analysis process and visually provide the results. Tools for financial analysis include Zoho Books, Xero, QuickBooks, and more.
Q3. What is the gearing ratio?
Answer: A gearing ratio is a leverage ratio that assesses how much debt a company uses to fund its activities instead of equity. It shows how much of a company’s funding comes from creditors rather than investors.
Recommended Articles
This is a guide to Ratio Analysis Types. Here we discuss the introduction and Type of Ratio Analysis, including liquidity, profitability, and solvency ratios. You may also look at the following articles to learn more –

