Updated July 11, 2023
Accounting Ratio Formula (Table of Contents)
What is the Accounting Ratio Formula?
The term “Accounting Ratio” refers to the collection of all the ratios used to analyze a company’s financial position. The ratios are called so because they are used in accounting.
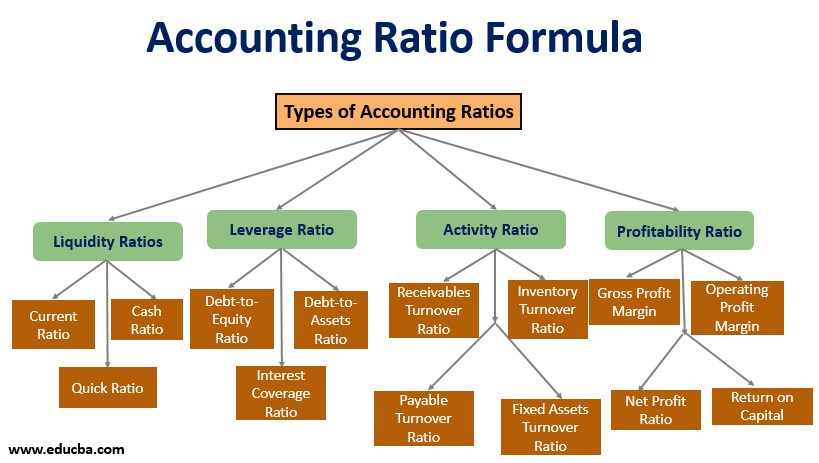
Many such standard ratios are used to assess companies’ financial position. The family of these accounting ratios is broadly classified into four major categories:
- Liquidity Ratio
- Leverage Ratio
- Activity Ratio
- Profitability Ratio
Example of Accounting Ratio Formula (With Excel Template)
Let’s take an example to better understand the Accounting Ratio calculation in a better manner.
Accounting Ratio Formula – Example #1
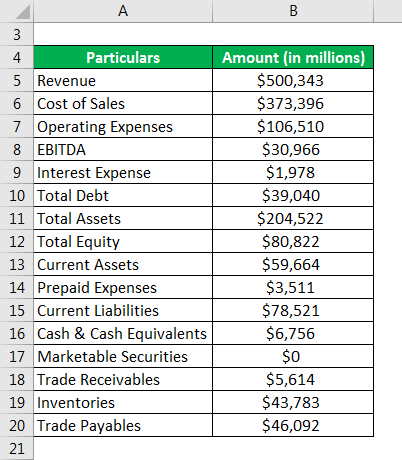
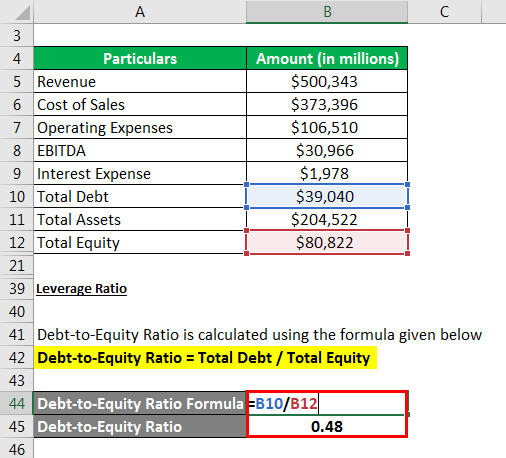
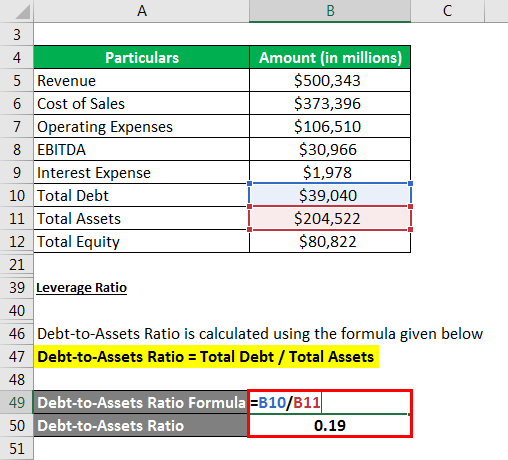
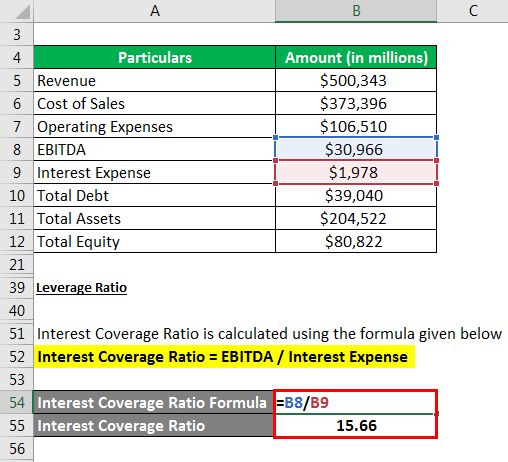
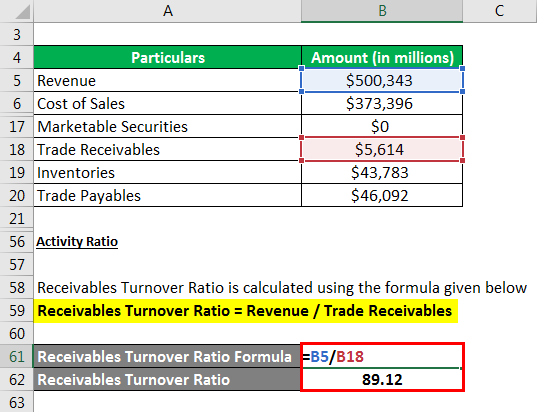
Let us take the example of Walmart Inc.’s annual report for 2018 to illustrate the calculation of accounting ratios. The following information is available in the annual report:
Solution:
Liquidity Ratio
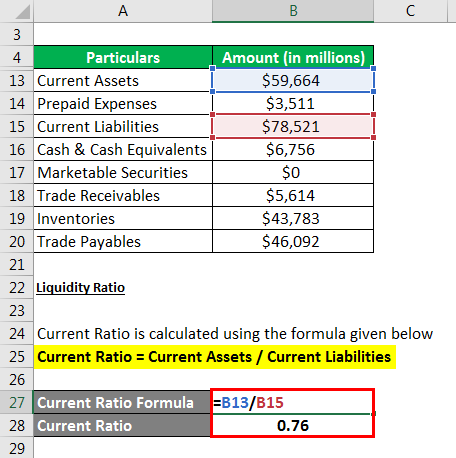
Current Ratio is calculated using the formula given below
- Current Ratio = $59,664 million / $78,521 million
- Current Ratio= 0.76x
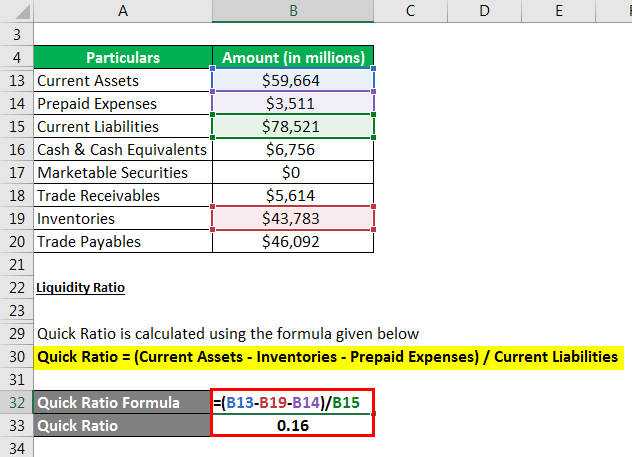
Quick Ratio is calculated using the formula given below
- Quick Ratio = ($59,664 million – $43,783 million – $3,511 million) / $78,521 million
- Quick Ratio = 0.16x
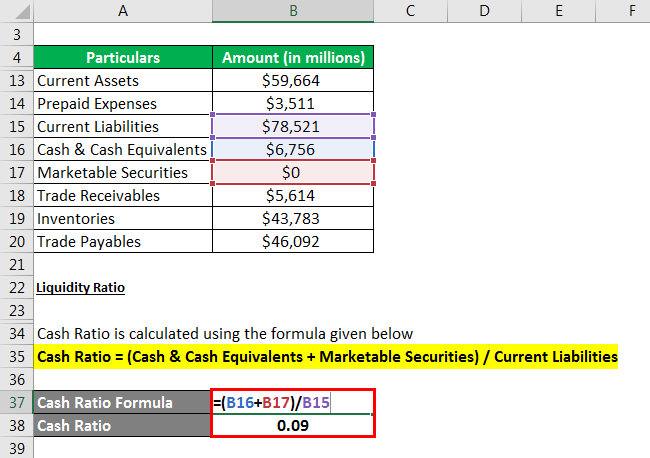
Cash Ratio is calculated using the formula given below
- Cash Ratio = ($6,756 million + 0) / $78,521 million
- Cash Ratio = 0.09x
Leverage Ratio
Debt-to-Equity Ratio is calculated using the formula given below
- Debt-to-Equity Ratio = $39,040 million / $80,822 million
- Debt-to-Equity Ratio = 0.48x
Debt-to-Assets Ratio is calculated using the formula given below
- Debt-to-Assets Ratio = $39,040 million / $204,522 million
- Debt-to-Assets Ratio = 0.19x
Interest Coverage Ratio is calculated using the formula given below
- Interest Coverage Ratio = $30,966 million / $1,978 million
- Interest Coverage Ratio = 15.66x
Activity Ratio
Receivables Turnover Ratio is calculated using the formula given below
- Receivables Turnover Ratio = $500,343 million / $5,614 million
- Receivables Turnover Ratio = 89.12x
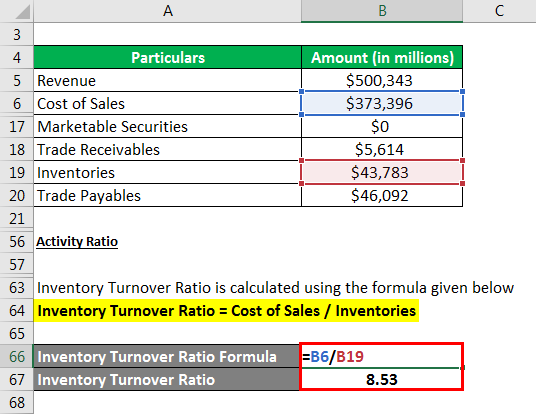
Inventory Turnover Ratio is calculated using the formula given below
- Inventory Turnover Ratio = $373,396 million / $43,783 million
- Inventory Turnover Ratio = 8.53x
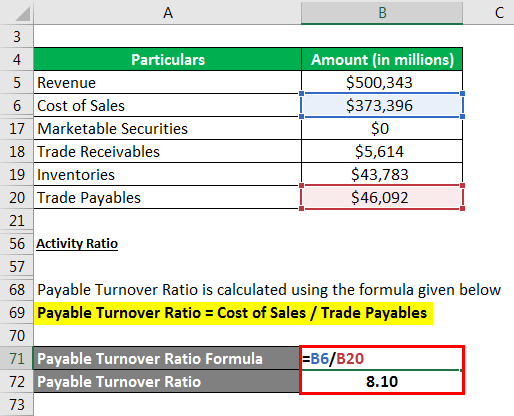
The payable Turnover Ratio is calculated using the formula given below
- Payable Turnover Ratio = $373,396 million / $46,092 million
- Payable Turnover Ratio = 8.10x
Profitability Ratio
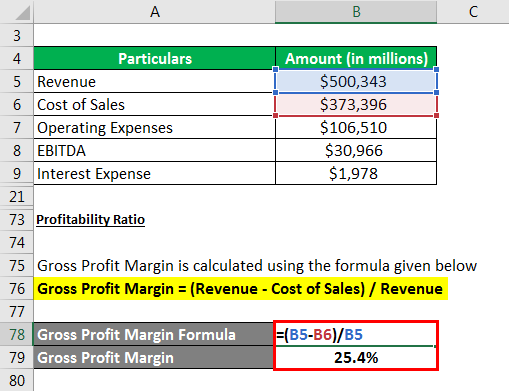
Gross Profit Margin is calculated using the formula given below
- Gross Profit Margin = ($500,343 million – $373,396 million) / $500,343 million
- Gross Profit Margin = 25.4%
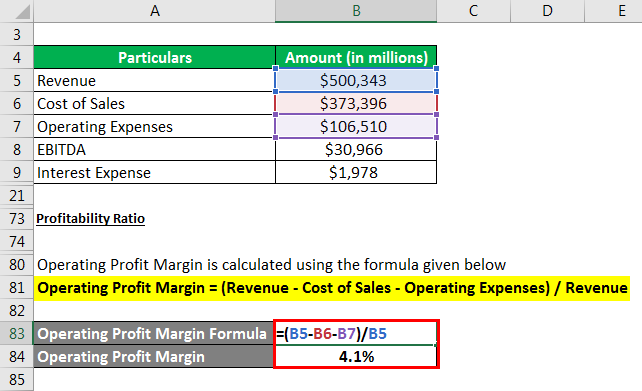
Operating Profit Margin is calculated using the formula given below
- Operating Profit Margin = ($500,343 million – $373,396 million – $106,510 million) / $500,343 million
- Operating Profit Margin = 4.1%
Explanation
The formula for Accounting Ratio can be calculated by using the following steps:
Liquidity Ratio: These ratios indicate the short-term liquidity position of a company. Some of the major liquidity ratios are discussed below.
Current Ratio: This ratio shows how well the short-term assets cover the short-term liabilities in cash, inventories, receivables, etc. It is mathematically represented as current assets divided by current liabilities.
Current Ratio = Current Assets / Current Liabilities
Quick ratio: This ratio indicates the coverage of the short-term liabilities by the short-term assets, which are easy to liquidate. It is mathematically represented as current assets minus inventories and prepaid expenses divided by current liabilities.
Quick Ratio = (Current Assets – Inventories – Prepaid Expenses) / Current Liabilities
Cash Ratio: This ratio shows the percentage of the short-term liabilities covered by the most liquid assets (cash and other liquid marketable securities). It is mathematically represented as cash & cash equivalents plus marketable securities divided by current liabilities.
Cash Ratio = (Cash & Cash Equivalents + Marketable Securities) / Current Liabilities
Leverage Ratio: These ratios assess a company’s capital structure. Some of the major leverage ratios are discussed below.
Debt-to-Equity Ratio: This ratio indicates the capital structure, which shows the company’s dependency on the debt fund vis-à-vis its fund. It is mathematically represented as total debt divided by total equity.
Debt-to-Equity Ratio = Total Debt / Total Equity
Debt-to-Asset Ratio: This ratio shows what percentage of the company’s assets are funded through debt financing. It is mathematically represented as total debt divided by total assets.
Debt-to-Asset Ratio = Total Debt / Total Assets
Interest Coverage Ratio: This ratio indicates the capability of a company to pay off its financial expenses or interest obligations. It is mathematically represented as earnings before interest, tax, depreciation & amortization (EBITDA) divided by interest expense.
Interest Coverage Ratio = EBITDA / Interest Expense
Activity Ratio: These ratios assess a company’s ability to utilize available assets efficiently. Some of the major activity ratios are discussed below.
Receivables Turnover Ratio: This ratio indicates how quickly a company can collect its receivables. It is mathematically represented as revenue divided by trade receivables.
Receivables Turnover Ratio = Revenue / Trade Receivable
Inventory Turnover Ratio: This ratio shows how a company can convert its inventories into cash. It is mathematically represented as the cost of sales divided by inventories.
Inventory Turnover ratio = Cost of Sales / Inventories.
Payable Turnover Ratio: This ratio shows how well a company can manage its supplier payments. It is mathematically represented as the cost of sales divided by trade payables.
Payable Turnover ratio = Cost of Sales / Trade Payable.
Profitability Ratio: These ratios help assess a company’s ability to generate profits from its operations. Some of the major profitability ratios are discussed below.
Gross Profit Margin: This ratio indicates a company’s profitability after deducting all the directly assignable expenses. It is mathematically represented as revenue minus the cost of sales divided by revenue.
Gross Profit Margin = (Revenue – Cost of Sales) / Revenue
Operating Profit Margin: This ratio indicates a company’s profitability after deducting all the direct and indirect expenses of operations. It is mathematically represented as revenue minus cost of sales and operating expenses divided by revenue.
Operating Profit Margin = (Revenue – Cost of Sales – Operating Expenses) / Revenue
Relevance and Use of Accounting Ratio Formula
These ratios are calculated using the financial information available mostly in the annual reports and are useful for comparing companies’ performances with different scales of operations.
Recommended Articles
This is a guide to Accounting Ratio Formula. Here we discuss how to calculate the Accounting Ratio along with practical examples. We also provide an Accounting Ratio downloadable excel template. You may also look at the following articles to learn more –
