Updated March 31, 2023
Introduction to React Native Charts
The following article provides an outline on React Native Charts. Charts are attractive visual elements which help in boosting the feel and look of one’s mobile application. By adding charts as a design tool, one can make their application attractive, while also uplifting the user experience. Charts efficiently convey data stories and are very easy to read. With its components, one’s application’s story telling becomes very powerful. One can create contribution graphs, progress charts, bar charts, pie charts, Bezier line charts and line charts very easily and efficiently. They provides a Charts API which is highly customizable, very responsive, easy to plug-in and very easy to use.
Syntax of importing Chart Kit
1. Using Yarn
yarn add react-native-chart-kit2. Using NPM
npm install react-native-chart-kitSyntax of importing Chart Components
import { LineChart,
BarChart,
PieChart,
ProgressChart,
ContributionGraph,
StackedBarChart
} from 'react-native-chart-kit'
Examples of React Native Charts
Given below are the examples:
Example #1
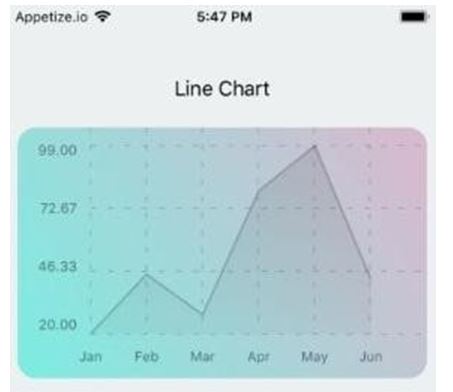
Line Chart
Code:
import * as React from 'react';
import { Text, View, StyleSheet, Dimensions, ScrollView } from 'react- native';
import {
LineChart,
BarChart,
PieChart,
ProgressChart,
ContributionGraph,
StackedBarChart,
} from 'react-native-chart-kit';
export default class App extends React.Component {
render() {
return (
<ScrollView>
<View style={styles.container}>
<View>
{/*It is an Example of LineChart*/}
<Text
style={{
textAlign: 'center', fontSize: 18,
padding: 16,
marginTop: 16,
}}>
Line Chart
</Text>
<LineChart data={{
labels: [ 'Jan',
'Feb',
'Mar',
'Apr',
'May',
'Jun',
],
datasets: [
{
data: [20, 45, 28, 80, 99, 43],
strokeWidth: 2,
},
],
}}
width={Dimensions.get('window').width - 16}
height={220}
chartConfig={{
backgroundColor: '#c92ac7',
backgroundGradientFrom: '#7bede2',
backgroundGradientTo: '#dbb8cd',
decimalPlaces: 2,
color: (opacity = 1) => `rgba(0, 0, 0, ${opacity})`,
style: {
borderRadius: 16,
},
}}
style={{ marginVertical: 8,
borderRadius: 16,
}}
/>
</View>
</View>
</ScrollView>
);
}
}
const styles = StyleSheet.create({
container: {
flex: 1,
justifyContent: 'center', padding: 8,
paddingTop: 30,
backgroundColor: '#ecf0f1',
},
});
Output:
Example #2
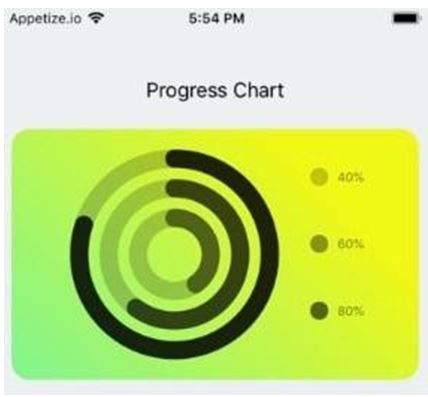
Progress Chart
Code:
import * as React from 'react';
import { Text, View, StyleSheet, Dimensions, ScrollView } from 'react- native';
import {
LineChart,
BarChart,
PieChart,
ProgressChart,
ContributionGraph,
StackedBarChart,
} from 'react-native-chart-kit';
export default class App extends React.Component {
render() {
return (
<ScrollView>
<View style={styles.container}>
<View>
{/*It is an Example of Progress Chart*/}
<Text
style={{
textAlign: 'center', fontSize: 18,
padding: 16,
marginTop: 16,
}}>
Progress Chart
</Text>
<ProgressChart data={[0.4, 0.6, 0.8]}
width={Dimensions.get('window').width - 16} height={220}
chartConfig={{
backgroundColor: '#cc14aa',
backgroundGradientFrom: '#7ff591',
backgroundGradientTo: '#f0f716',
decimalPlaces: 2,
color: (opacity = 1) => `rgba(0, 0, 0, ${opacity})`,
style: {
borderRadius: 16,
},
}}
style={{ marginVertical: 8,
borderRadius: 16,
}}
/>
</View>
</View>
</ScrollView>
);
}
}
const styles = StyleSheet.create({
container: {
flex: 1,
justifyContent: 'center', padding: 8,
paddingTop: 30, backgroundColor: '#ecf0f1',
},
});
Output:
Example #3
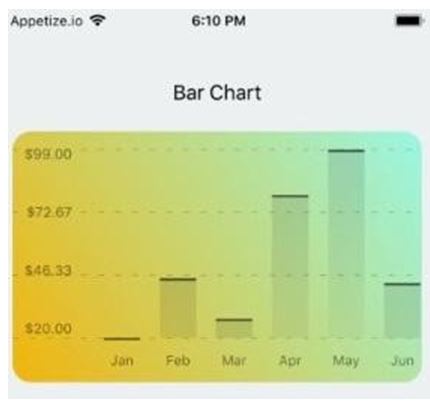
Bar Chart
Code:
import * as React from 'react';
import { Text, View, StyleSheet, Dimensions, ScrollView } from 'react- native';
import {
LineChart,
BarChart,
PieChart, ProgressChart,
ContributionGraph,
StackedBarChart,
} from 'react-native-chart-kit';
export default class App extends React.Component {
render() {
return (
<ScrollView>
<View style={styles.container}>
<View>
{/*It is an Example of Bar Chart*/}
<Text
style={{
textAlign: 'center',
fontSize: 18,
padding: 16,
marginTop: 16,
}}>
Bar Chart
</Text>
<BarChart data={{
labels: [ 'Jan',
'Feb',
'Mar',
'Apr',
'May',
'Jun',
],
datasets: [
{
data: [20, 45, 28, 80, 99, 43],
},
],
}}
width={Dimensions.get('window').width - 16}
height={220}
yAxisLabel={'$'} chartConfig={{
backgroundColor: '#10c9bd',
backgroundGradientFrom: '#f2b40a',
backgroundGradientTo: '#99f7e3',
decimalPlaces: 2,
color: (opacity = 1) => `rgba(0, 0, 0, ${opacity})`,
style: {
borderRadius: 16,
},
}}
style={{ marginVertical: 8,
borderRadius: 16,
}}
/>
</View>
</View>
</ScrollView>
);
}
}
const styles = StyleSheet.create({
container: {
flex: 1,
justifyContent: 'center', padding: 8,
paddingTop: 30, backgroundColor: '#ecf0f1',
},
});
Output:
Example #4
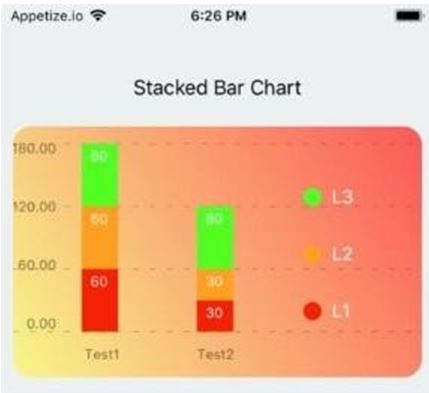
Stacked Bar Chart
Code:
import * as React from 'react';
import { Text, View, StyleSheet, Dimensions, ScrollView } from 'react- native';
import {
LineChart,
BarChart,
PieChart,
ProgressChart,
ContributionGraph,
StackedBarChart,
} from 'react-native-chart-kit';
export default class App extends React.Component {
render() {
return (
<ScrollView>
<View style={styles.container}>
<View>
{/*It is an Example of StackedBar Chart*/}
<Text
style={{
textAlign: 'center'
fontSize: 18,
padding: 16,
marginTop: 16,
}}>
Stacked Bar Chart
</Text>
<StackedBarChart data={{
labels: ['Test1', 'Test2'],
legend: ['L1', 'L2', 'L3'],
data: [[60, 60, 60], [30, 30, 60]],
barColors: ['#f52105', '#ff9e1f', '#53ff1f'],
}}
width={Dimensions.get('window').width - 16}
height={220}
chartConfig={{
backgroundColor: '#10abc9',
backgroundGradientFrom: '#f7f78b',
backgroundGradientTo: '#fc5858',
decimalPlaces: 2,
color: (opacity = 1) => `rgba(0, 0, 0, ${opacity})`, style: {
borderRadius: 16,
},
}}
style={{ marginVertical: 8,
borderRadius: 16,
}}
/>
</View>
</View>
</ScrollView>
);
}
}
const styles = StyleSheet.create({
container: {
flex: 1,
justifyContent: 'center', padding: 8,
paddingTop: 30, backgroundColor: '#ecf0f1',
},
});
Output:
Example #5
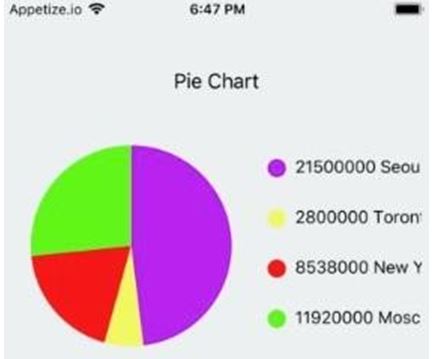
Pie Chart
Code:
import * as React from 'react';
import { Text, View, StyleSheet, Dimensions, ScrollView } from 'react- native';
import {
LineChart,
BarChart,
PieChart,
ProgressChart,
ContributionGraph,
StackedBarChart,
} from 'react-native-chart-kit';
export default class App extends React.Component {
render() {
return (
<ScrollView>
<View style={styles.container}>
<View>
{/*It is an Example of Pie Chart*/}
<Text
style={{
textAlign: 'center',
fontSize: 18,
padding: 16,
marginTop: 16,
}}>
Pie Chart
</Text>
<PieChart data={[
{
name: 'Seoul',
population: 21500000,
color: '#b81ff0',
legendFontColor: '#050505',
legendFontSize: 15,
},
{
name: 'Toronto',
population:  2800000,
color: '#f2f763',
legendFontColor: '#050505',
legendFontSize: 15,
},
{
name: 'New York',
population: 8538000,
color: '#f51818',
legendFontColor: '#050505',
legendFontSize: 15,
},
{
name: 'Moscow',
population: 11920000,
color: '#62f518',
legendFontColor: '#050505',
legendFontSize: 15,
},
]}
width={Dimensions.get('window').width - 16} height={220}
chartConfig={{ backgroundColor: '#194ad1',
backgroundGradientFrom: '#f74871',
backgroundGradientTo: '#ffbc47',
decimalPlaces: 2,
color: (opacity = 1) => `rgba(0, 0, 0, ${opacity})`,
style: {
borderRadius: 16,
},
}}
style={{ marginVertical: 8,
borderRadius: 16,
}}
accessor="population"
backgroundColor="transparent"
paddingLeft="15"
absolute
/>
</View>
</View>
</ScrollView>
);
}
}
const styles = StyleSheet.create({
container: {
flex: 1,
justifyContent: 'center',
padding: 8,
paddingTop: 30,
backgroundColor: '#ecf0f1',
},
});
Output:
Conclusion
On the basis of above discussion, we got to know about different charts that can be created. These charts helps in providing the best user experience based in mobile applications. We have created Line chart, progress chart, bar chart, stacked bar chart and pie chart, although contribution chart and Bezier line chart can also be created in it. It is very easy and efficient to implement these charts to upgrade UI/UX.
Recommended Articles
This is a guide to React Native Charts. Here we discuss the introduction, syntax and examples of React Native Charts along with code implementation. You may also have a look at the following articles to learn more –


