Updated February 10, 2023

Introduction to Kibana Logstash
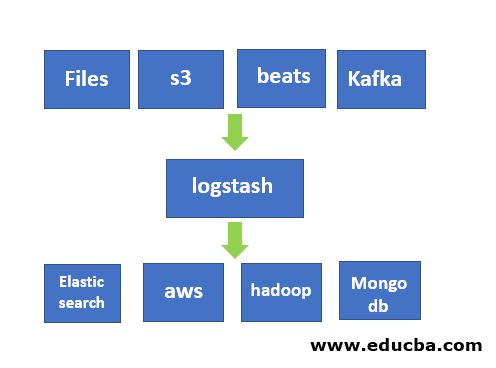
The following article provides an outline for Kibana Logstash. Logstash is a tool which is an open-source (free under the license of Apache) used for the ingestion data from one source to another source. Basically logstash is used for the reading logs but now this has a lot of features that make it beyond from that. It can take input very different kinds of sources like files, weblogs, Apache Kafka, Syslog, etc. Logstash has also the capability to take input and then it can filter that data according to requirements of destination which not disturb the original data which coming from any source.
It filters and modifies data inside of the logstash while keeping the original data the same. Logstash also helps to make a decision very easy on logs as query through logs very easily. Also logstash have a different type of input supports, same it has different kinds of output sources which it supports like Apache Kafka, Apache Spark, Elasticsearch, Storage Devices, Files, etc.
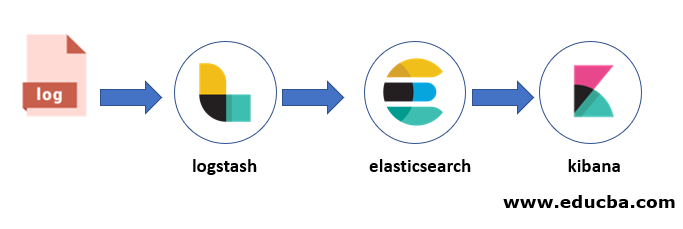
Logstash Kibana Architecture
The above architecture is an external form that shows how data flow from the logstash to kibana through elasticsearch which is a part of stack ELK (Elasticsearch Logstash Kibana).
Install Logstash
To install logstash just download the logstash from the below link:
https://www.elastic.co/downloads/logstash
We download the .tar file to install logstash on our machine for demo. You can install it as per your choice.
After downloading the tarball then unzip that in a particular folder. Below showing my laptop path which might be different according to your folder path. We kept logatsh-7.7.0 inside of the elasticsearch directory (which we created).
/home/puche/Applications/elasticsearch/logstash-7.7.0/bin
Before run the logstash, we have to create a .conf file which have to run.
Structure of Conf File
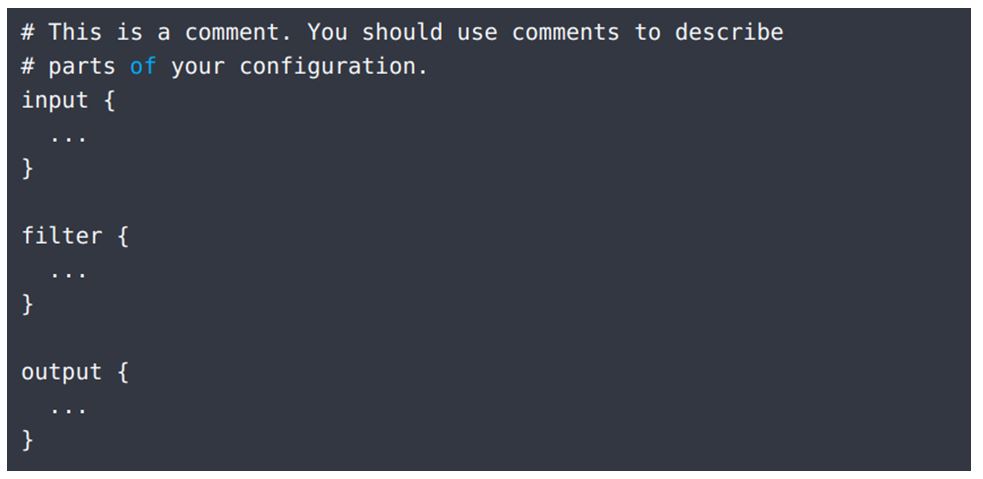
There are three major concepts inside of the conf file which are input, filter and output as give below in screenshot.
To create a conf file follow the following steps:
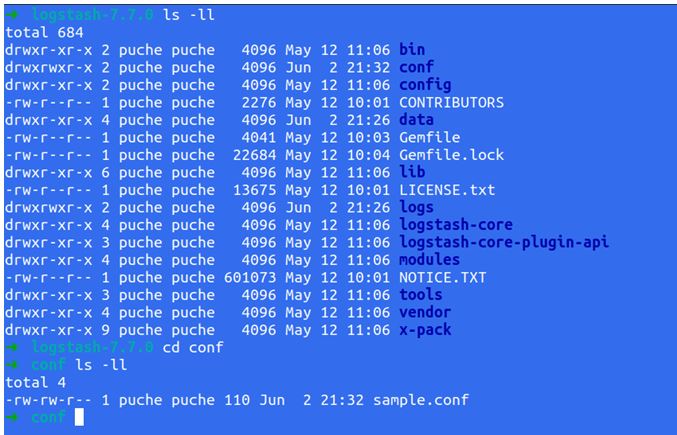
- Go to the logstash inside and create a directory with name conf (name you can choose as per your choice).
- Go to inside of that conf file and create a file name sample.conf.
- Save that file and exit.
Example:
sample.conf example is given below:
Code:
output {

elasticsearch

{

hosts => ["localhost:9200"]
}

stdout

{

codec => rubydebug

}

}
Now, we have conf file inside of the logstash. We can verify it through this command:
Output:
Then we have to go to bin folder which is inside of the logstash-7.7.0 (current version) and then run like below:
Code:
$ logstash-7.7.0

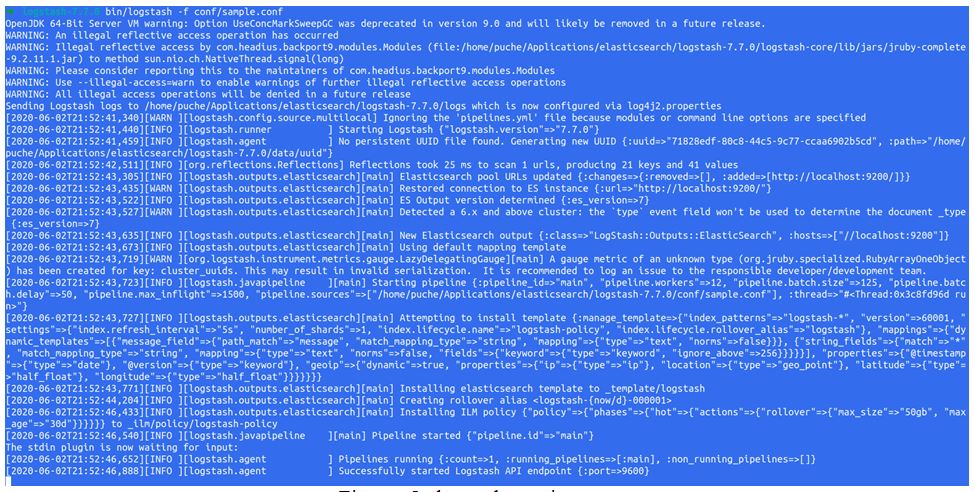
logstash-7.7.0 $ bin/logstash -f conf/sample.conf
Output:
Example of Kibana Logstash
Before running the logstash, you must run elasticsearch because all data must go from input to logstash central which transfers data to elastic search for indexing, and then we can use Kibana to visualize that data in the web.
If you have not yet install elastic search then go to the following link and download the .tar file and unzip it like logstash and then go to inside of that bin folder and run as below.
path-of-the-elasricsearch/bin$ ./elasticsearch
After starting the elastic search, then we have to start the Kibana. The process is the same as above if you are using Linux/Ubuntu.
path-of-the-kibana/bin $ ./kibana
First, we create a table inside of the mysql which we will fetch through the logstash and ingestion into elasticsearch for indexing and then use kibana for visualize all those data.
Code:
use test;

Database changed

create table example(

-> id INT(6),

-> firstname VARCHAR(30) NOT NULL,

-> lastname VARCHAR(30) NOT NULL,

-> email VARCHAR(50)

-> )

-> ;
Here in the above, we created a database which name is a test, and inside of that database (test), we created a new table which name is an example.
Logstash Conf File to Fetch Data from MySQL
To do fetch data from mysql we have to follow the following steps:
1. Download the mysql connector from the below link:
https://downloads.mysql.com/archives/c-j/
2. After download keep this in any folder and unzip it.
3. Now we have to create a conf file like this:
Code:
input {

jdbc {

jdbc_driver_library => /home/puche/Applications/elasticsearch/jars/mysql-connector-java-5.1.42/mysql-connector-java-5.1.42-bin.jar”

jdbc_driver_class => "com.mysql.jdbc.Driver"

jdbc_connection_string => "jdbc:mysql://localhost:3306/test"

jdbc_user => “root"

jdbc_password => "********"

statement => "select * from example”

}

}

output {

elasticsearch {

hosts => “localhost:9200”

index => “sample”

document_type => “doc”

}

stdout {

codec => json_lines

}

}
Now our conf file is ready and we save the above conf file with the same name as before sample.conf (you can save with any name as you like).
Now we are going to run logstash to see screen output which fetches data from MySQL to logstash and then transfer those data to elastic search for indexing which name will be kibana Logstash as we mentioned in our conf file. Then we open the Kibana to look that data into the web.
Before start conf file, please make sure you have data in MySQL.
So we are going to fetch these data from MySQL to Elasticsearch and visualize in Kibana.
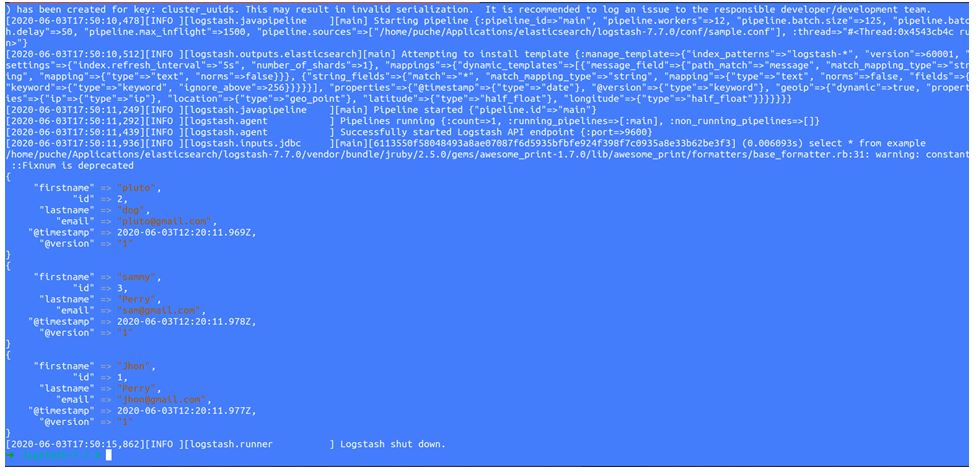
4. Now we have to run sample.conf file as we did before and it will show data on screen like this:
Now, we can see all those data which were in MySQL has accessed by logstash and push it into elastic search for indexing.
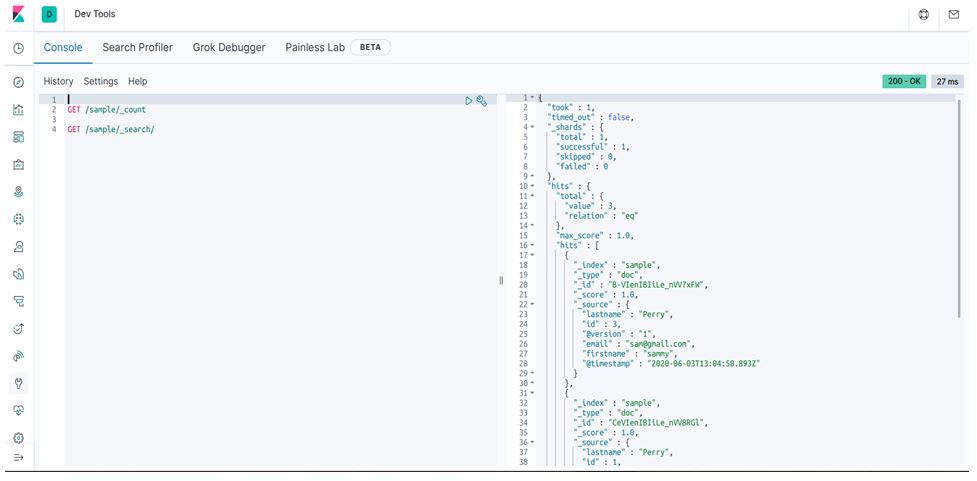
Now we open kibana and look all those data from there. Here sample is our index.
Conclusion – Kibana Logstash
As we have seen how logstash works and process data from MySQL as an example and the same index sample we can view data from the Kibana dev tool. So Kibana not only doing this, it has more capability.
Recommended Articles
This is a guide to Kibana Logstash. Here we discuss logstash kibana architecture, install logstash, structure of conf file, example and logstash conf file to fetch data from MySQL. You may also have a look at the following articles to learn more –
