Introduction to Matlab Images
Image Processing apps are provided by MATLAB in the form of a toolbox that helps us in automating commonly used image processing techniques and workflows by enabling interactive segmentation of image data, comparison of image registration methods, and batch processing of large datasets. Image processing in MATLAB lets us explore any image or video and make changes like adjusting the contrast, manipulating ROI (regions of interest) and create histograms to understand the definition of the image.
Here is the list of some of the most commonly used functions for processing image in MATLAB:
- imread(): This function is used to read or load the image which we want to process
- imshow(): This function is used to display the image that we have loaded
- imagesc(): This function is used to display the image by utilizing the full set of colors present in the colormap. A color scale can also be used after calling this function to get a better idea of the colors present
- imhist(): Using This function we can check how the pixel intensity of the image is distributed
- histeq(): Using this function we can edit the contrast of our image
- imwrite(): This function is used to insert our edited image into a file
- iminfo(): This function is used to confirm if our edited file is loaded into a disk file
Functions for Matlab Images
Let us now understand the use of all the above functions in MATLAB. We will use an image that is stored in MATLAB’s image processing app and will execute all the above functions in steps for that image.
Step 1
In the first step, we Load or Read the image into our workspace.
Code:
imageInput = imread ('moon.tif');
Step 2
In this step we will display our image in the workspace.
Code:
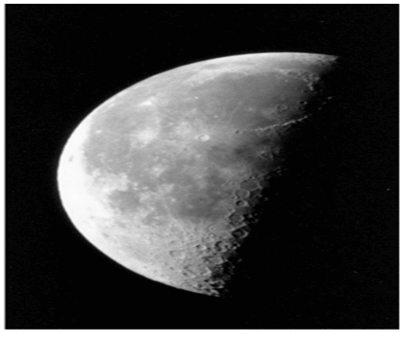
imshow (imageInput)
As we can see in the output, the image is loaded in our workspace.
Step 3
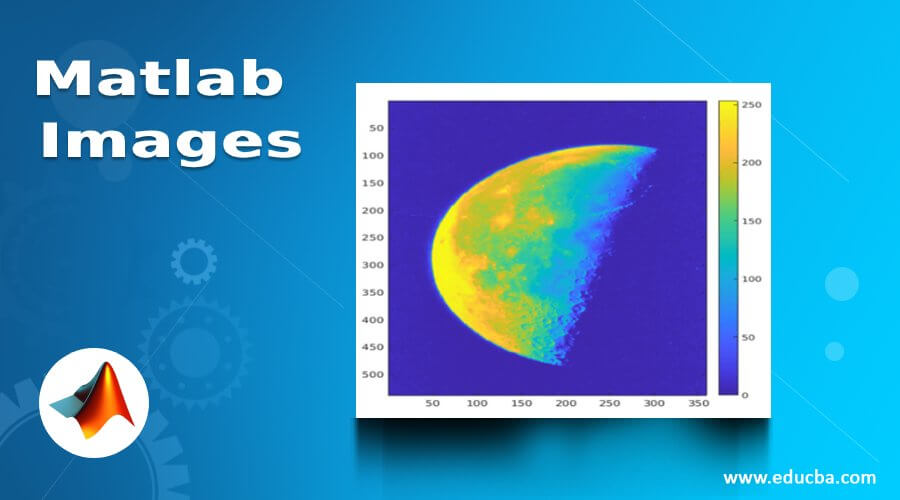
In this step we will display our image with the colors from the colormap. We will also use a color bar to check the intensity of the colors.
Code:
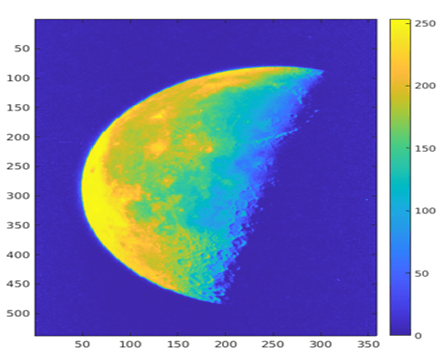
imagesc (imageInput)
colorbar
As we can see in the output, the image is displayed and has a full range of colors in the colormap and we also have a color bar next to it.
Step 4
In this step we will check the intensity of pixels in our image. We will be using the figure function to display the intensity in the form of a histogram.
Code:
figure
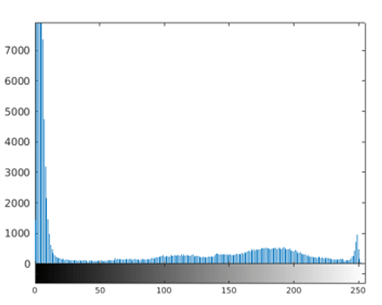
imhist (imageInput)
As we can see in the output, the range of pixel intensity for our image is very narrow, i.e the values are concentrated in a small range at the beginning.
Step 5
In this step, we will edit the contrast of our image. This is done because we found in the above step, that our image has very narrow pixel intensity.
Code:
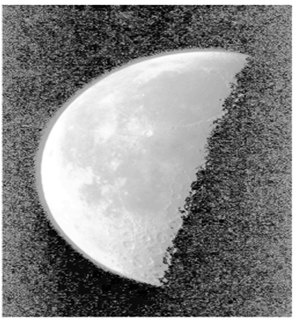
newImage = histeq (imageInput);
figure

imshow (newImage)
As we can see in the output, the contrast of our image has changed drastically.
Step 6
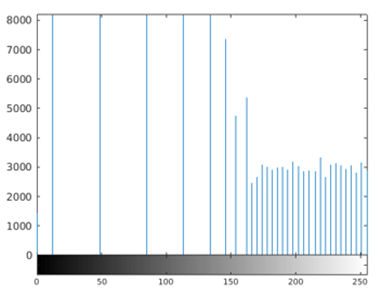
In this step, let us call ‘imhist’ function again with ‘newImage’ as the input. This will confirm that contrast or pixel intensities of the new image created are now distributed in a better way
Code:
figure

imhist (newImage)
As we can see in the histogram above, the pixel intensities of the new image created are now distributed in a better way.
Step 7
In this step, we will insert the new image into disk file.
Code:
imwrite (newImage, 'moon2.png');
Step 8
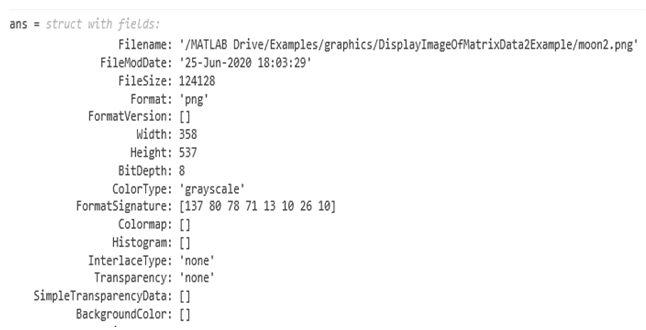
Finally, we will confirm if our image is saved in the disk file or not using the ‘iminfo’ function. This will also give us all other details like file size, format, width, height, etc.
Code:
imfinfo ('moon2.png')
As we can see in the output, the file is saved as expected by us. We also have all other information related to the image.
Conclusion
Image processing app can be used in MATLAB to perform various operations on an image, ranging from loading the image editing it and saving it in the disk file. The image processing can be used to process both 2D& 3D images.
Recommended Articles
This is a guide to Matlab Images. Here we also discuss the introduction and use of functions in matlab along with examples and its code implementation. You may also have a look at the following articles to learn more –

