Updated June 16, 2023
Overview of Statistical Learning
People can comprehend statistics as a study of collecting and analyzing data. Statistical Learning servers as a means to extract facts and summarize the available data. Since the 18th century, people have predominantly utilized statistics for taxation and military purposes. Later towards the end of the 20th century, with the advent of computers, the applications of statistical concepts broadened with its contributions towards technologies such as Machine Learning and Neural Nets. In this topic, we will learn about Introduction to Statistical Learning.
Statistical Learning enables data prediction and classification by effectively handling large volumes of data. It involves performing numerous iterations to analyze and select the most valuable and relevant data, ultimately leading to an optimized result.
What is Statistical Learning?
Data is the fuel that drives Statistical Learning, and statistics are all about making sense of the data in hand. The results obtained from statistical learning help us determine trends and predict a possible outcome for the future.
Statistical Learning is a tool to accomplish the goals of supervised and unsupervised Machine Learning techniques. With supervised statistical learning, we get to predict or estimate an outcome based on previously present output, whereas, with unsupervised statistical learning, we find various patterns present within the data by clustering them into similar groups.
This article shows Supervised Statistical Learning methodologies, namely Regression and Classification.
1. Regression
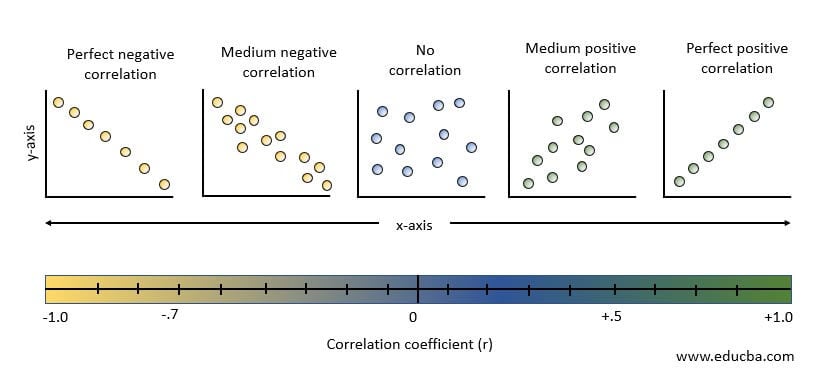
Ever wondered how stock market predictions work? Or how a realtor estimates a house price? Or want to know if a new car in the market is worth the buy? If yes, you can find answers to these in Regression’s statistical methodology. We utilize regression equations and analysis to make unbiased and accurate predictions of quantitative data. In addition, regression Analysis helps us to identify the relationship between two or more variables.
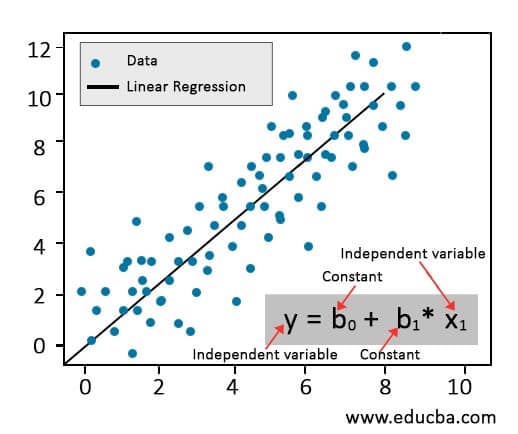
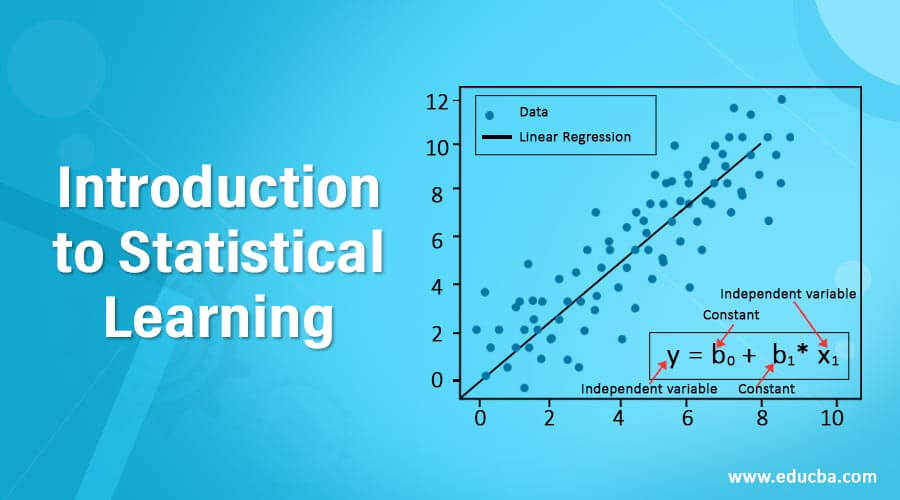
In Simple Linear Regression (SLR), the relationship between a dependent variable (Y) and an independent variable (X) is determined. The equation illustrated below estimates how any change in X will affect Y.
Bias-Variance Trade-off:
Linear Regression is all about finding the best fit straight line. Errors in regression models are mainly due to bias and variance. Minimizing these two prediction errors is essential to obtain a generalized model that works well on training and testing data sets.
Bias:
The linear Regression Model assumes the target variable has a linear relationship with its features. In reality, though, this might not be the case, and the inability of the Linear Regression model to capture the true relationship is termed bias. The error due to bias is determined by calculating the difference between predicted and actual values.
Variance:
The variance gives us a picture of how far the data points under consideration are spread. The Variance error refers to the fluctuations in the predictions when data sets are changed and are calculated as the variability of a model prediction from a given data point.
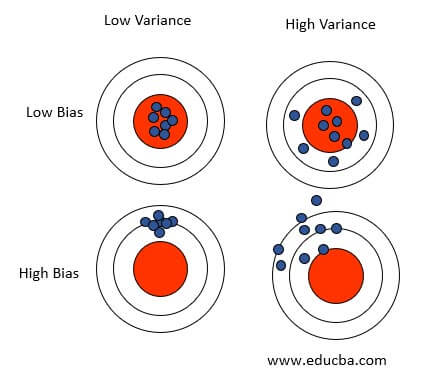
Consider the scenarios where a model has high bias and low variance; then, it is likely to be less complex and probably will tend to underfit the data. If the model has low bias and high variance, it will likely overfit the data, making it more complex and inconsistent when tried for unseen inputs. Hence to avoid such scenarios, there is a need to come to a common ground w.r.t the bias and variance to have an acceptable model.
An ideal model is selected to have a low bias that can capture the proper relationship between its variables and low variance that produces consistent predictions across different datasets. This can be achieved by obtaining a sweet spot between a simple and complex Regression Model. Regularization, bagging, and boosting help achieve the sweat spot.
2. Classification
Classification is applied to qualitative (non-numeric) data wherein the target variable can be classified or grouped into two (Binary Classification) or more classes (Multi-Class Classification). Examples of Classification Statistical Learning include Tagging an e-mail as “spam” or “ham,” predicting customer churn, classifying animals based on their breeds, etc.
In classification, the output is often obtained using probabilistic approaches so that the results from the statistical inference give out a probability of an instance belonging to a class rather than just assigning the best class.
Logistic Regression:
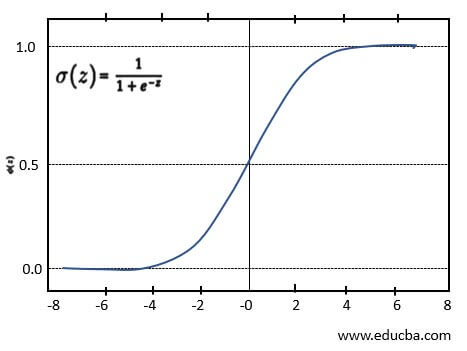
People widely use Logistic Regression as one of the classification algorithms for binary classification. This model uses a logistic function to determine the target value between the range of 0 to 1 and can be represented as the Sigmoid function shown below.
Why do we Need Statistical Learning?
In today’s age, if one thing is becoming more abundant than natural resources, then that ought to be Data. A million bytes of data we generate daily need a source for analyzing and summering them. If not used wisely, people can easily misinterpret or manipulate these data to showcase only a particular point of view. Therefore, to avoid dangerous mishaps with data, Statistical Learning becomes a tool to ensure data integrity and proper and efferent usage.
Statistical Learning helps us understand why a system behaves the way it does. It reduces ambiguity and produces results that matter in the real world. Statistical Learning provides accurate results that can find medical, business, banking, and government applications.
Advantages
 |
Easily identifies patterns and trends. With the identified trends, targeting specific customers for specific products becomes more accessible. |
 |
Saves time. Hundreds and thousands of epochs for achieving the optimized result are possible within a few minutes. |
 |
Can work with large numbers and a wide variety of parameters. |
 |
Improves Decision Making and Prediction techniques by logically analyzing the data rather than calling shots based on “gut feeling.” |
 |
Once the system is functional, no human intervention is required except for occasional updates to maintain its functionality. |
Conclusion – Introduction to Statistical Learning
With our advancing technologies, we now deal with more statistics in our daily lives than ever. The correct interpretation of the stories told by every billion bytes of data we accumulate is impossible without intersecting statistics with other branches such as Data Mining, Machine Learning, and Artificial Intelligence.
Recommended Articles
This is a guide to Introduction to Statistical Learning. Here we discuss the introduction, why do we need statistical learning and advantages. You may also have a look at the following articles to learn more –
