Updated March 15, 2023

Introduction to Data Analytics Technique
With a large amount of data getting generated on daily transactions across several industries around the globe, there comes a requirement to analyze the same for getting better business insights. Data Analytics technique provides a viable solution for the above. The data can be extracted from multiple sources and is pre-processed which involves steps like validation, cleaning of data, etc. to segment it into various defined patterns. This comes under a stage called EDA (Exploratory Data Analysis) which helps in better understanding of the data and market trend. It helps in increasing the productivity and business acumen of an organization.
Data Analytics Technique in Detail
The demand for data analytics has increased over the years. Many techniques have been devised but eventually, it boils down to two categories:
- Qualitative Analysis: It can be used to gain insights into a particular practice. It does not have any predefined output categories. It can also perform an in-depth analysis of the data coming from a small sample. It can create patterns from insights and concepts. The sampling involved is theoretical.
- Quantitative Analysis: It helps in measuring the magnitude from a particular practice. It involves predefined output categories. It requires independent data from a large statistical sample. It follows the test hypothesis statistical technique to gain insights and patterns from the data. It can numerically aggregate the data and the output categories can be clustered. The sampling involved is statistical.
Other types of data analysis techniques are used by developers like Descriptive Analysis, Inferential Analysis, Text Analysis, Statistical Analysis, Diagnostic Analysis, Predictive Analytics, and Prescriptive Analytics. But all of these can be categorized under either Quantitative or Qualitative Analysis techniques which is more generic. The methodology discussed above depends on the requirement of the organization i.e. setup cost, technological stack, business ideology, customers, etc.
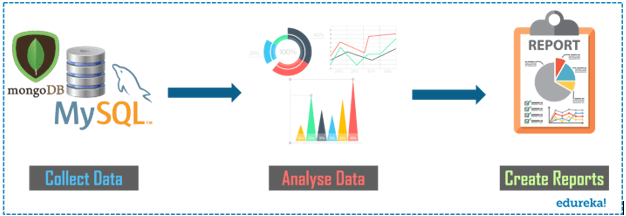
The data analysis can be performed in five stages that is Data Requirement and Gathering, Data Collection, Data Cleaning, Analyzing Data, Data Interpretation, and Data Visualization.
To achieve the above, many tools are available in the market. Let us discuss some of the most popular ones used.
1. R Programming:
This tool is popular among researchers, students, scientists, professional organizations, etc. for performing statistical analysis of data and generating models for the same. It is platform-independent as can be run on multiple platforms like UNIX, Windows, macOS, etc. It comes as a bundled-up package that provides the user with CLI (Command Line Interface) as well as the GUI that is RStudio. It allows the developers to install packages as per his/her requirement through the command line.
2. Python:
This tool comes under MIT license and is open-source and available on Github. It follows the OOP (Object Oriented Programming) directive. It comes up with CLI (Command Line Interface) tools that help the developer in installing packages as per his/her requirement. It provides various data analytics libraries/packages like NumPy, Pandas, etc. along with machine learning libraries like scikit-learn, Keras, TensorFlow, etc. It also comes up with data visualization libraries like Matplotlib, Seaborn, etc. It can be integrated with multiple platforms like MongoDB, SQL server, or JSON.
3. Tableau Public:
This tool comes under an open-source license which helps in connecting to any data source like a Data Warehouse or Excel. Many ETL (Extraction Transformation Loading) tools like Pentaho, Informatica, etc. send their processed data through this tool.
4. QlikView:
This tool is licensed and helps to process the data in memory. Thus, the processed results can be quickly reached to the end customer. It also offers user services such as data visualization and data associations even if the data comes in a compressed format.
5. SAS:
This tool is bundled-up as a programming language as well as an interactive platform. It provides the user with services such as data analytics and manipulation. It can be used to analyze data from various data sources.
6. Microsoft Excel:
It is one of the most popular tools among users. It helps in performing data analysis, creation of pivot tables, and generation of interactive reports/dashboard.
7. Rapid Miner:
This tool can be integrated with any popular data source type like Oracle, SQL Server, Sybase, etc. It also provides the user with services such as machine learning, text analytics, predictive analytics, etc.
8. KNIME (Konstanz Information Miner):
This tool is open-source which helps the user in data analysis and statistical modeling. It follows the modular pipelining concept which helps in data reporting and integration.
9. Open Refine:
This tool, better known as Google Refine performs data cleaning for analyzing the data. It helps the user to get rid of the unprocessed data which comes up from various sources like websites etc.
10. Apache Sparke:
This tool helps the user to process large-scale data by running the data on Hadoop cluster platforms. It thus helps the user to run data on a distributed server platform which helps in increasing the productivity and thus the efficiency of the applications. It also helps the user to develop machine learning models and data pipelines.
Benefits of Data Analytics Technique
- Decision Making: It helps the prospective user/organization to make faster, better-informed business decisions backed up by facts.
- Requirements: It helps the organization to understand the end customer needs/requirements better. Thus, it helps in fostering long-term business relationships with them.
- Risk Assessment: It helps the organization to gauge unforeseen risks better thus enabling them to implement preventive/corrective measures beforehand.
- Business Growth: It helps the organization to reduce maintenance costs and therefore increase the overall profits.
- Flexibility: It helps the organization to react better to unforeseen changes in fluctuating markets.
Conclusion
With the advancement in machine learning and deep learning techniques, data analysis has paved its way as large volumes of data are processed daily for identifying the patterns and thus getting better business insights. Its benefits have been understood by the organization and thus, is valued highly in the market.
Recommended Articles
This has been a guide to Data Analytics Technique. Here we discuss the introduction to Data Analytics Technique and its benefits. You may also look at the following article to learn more –


