Updated September 20, 2023
What is Descriptive and Inferential Statistics
“Inferential and descriptive statistics are two broad categories of statistics that define the characteristics of the dataset and deal with the interpretation, analysis, and interpretation of numerical data. This simple technique involves quantitative data collection to describe and summarize the data meaningfully. We can choose the group in descriptive and inferential statistics to record the data of the group; after the data is recorded, it will define the statistics. It will not contain any uncertainty because we describe the people items that we measure”.
There are two types of statistics available:
Applied statistics:
-
- This refers to the use of statistical methods to solve real-world problems in multiple fields like nature, health, and social sciences. This method involves collecting and interpreting the data to make predictions. The main goal of applied statistics is to extract meaningful information from decision-makers./li>
Theoretical statistics:
- This is a branch of statistics that focuses on statistical theory development. It is opposed to real-world application problems. The main aim of theoretical statistics is to establish the framework to use statistical inference.
Table of Contents
- What is Descriptive and Inferential Statistics
- Difference Between Descriptive and Inferential Statistics
- Comparison Between (Infographic)
- Key Differences
- Comparison Table
- Uses of Descriptive Statistics
- Uses of Inferential Statistics
Difference Between Descriptive and Inferential Statistics
Descriptive statistics allows us to describe a set of data; inferential statistics allows us to make inferences based on a set of data. Descriptive statistics report the characteristics of the data. Descriptive statistics do not contain any uncertainty. The statistics will describe the data that we have collected. If we collect data from the entire population, then we can compare this with descriptive statistics.
Most of the time, we can collect data from samples because doing so would be either too expensive or cumbersome for the entire group we are interested in. Inferential statistics, in contrast to descriptive statistics, uses our sample to make educated assumptions about the larger population. Descriptive statistics can only summarize the features of a sample. The use of unbiased, random sample techniques is crucial when using inferential statistics. We can’t generalize or draw meaningful statistical conclusions if our sample isn’t representative of our population.
What is Descriptive Statistics?
Data analysis that meaningfully describes and summarizes the data is known as descriptive statistics. It is an easy approach to explaining our data. To effectively and meaningfully show our raw data using mathematical computations, graphs, and tables. This kind of statistic is used on data that is already known.
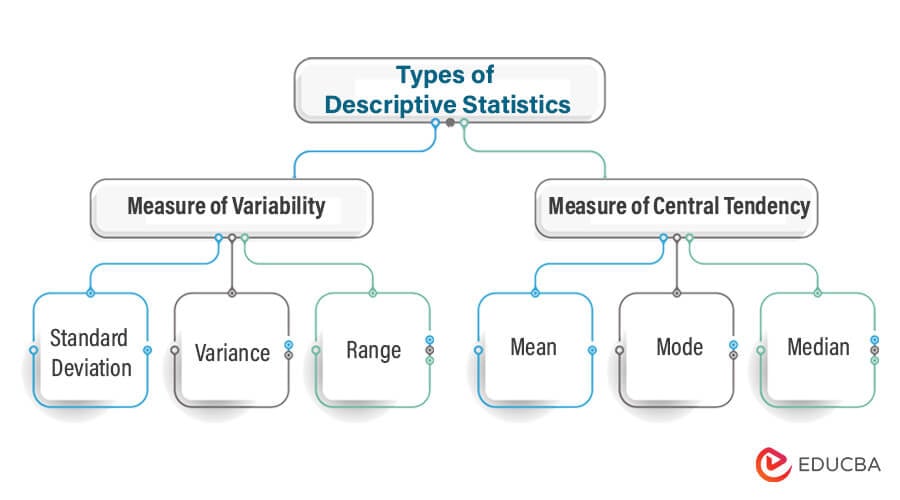
Below are the types of descriptive statistics as follows:
1. Measure of Variability
- Standard Deviation
- Variance
- Range
2. Measure of Central Tendency
- Mean
- Mode
- Median
When using descriptive statistics, a sizable number of sample data points are typically taken and condensed into a few useful graphs. Instead of just poring through sets of raw numbers, the approach enables us to understand the data and display it.
What is Inferential Statistics?
Any group of data we are interested in is used to make predictions in inferential statistics. It can be characterized as a random sample of information drawn from a population to describe and draw conclusions about the population. Any collection of data that contains all the information we are interested in is referred to as a population. In essence, it enables us to make predictions using a small sample size rather than trying to estimate the entire population’s behavior.
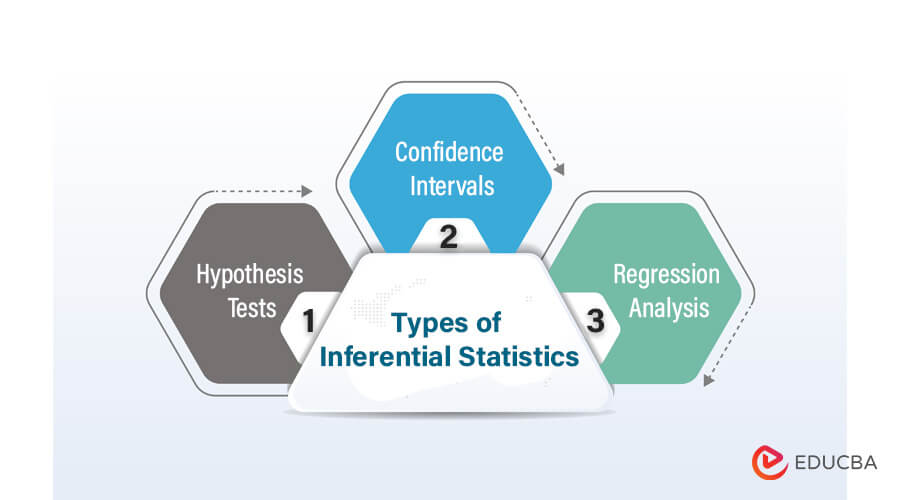
Below are the types of inferential statistics as follows:
- Hypothesis Tests: This is a statistical procedure that was used to make inferences about population parameters based on the data. The main aim of hypothesis testing is to determine the claim or assumption supported by the sample data.
- Confidence Intervals: This is a statistical tool used to estimate the values range of population parameters. We can express the confidence level in percentage that is associated with the estimate. To calculate the confidence interval, we need to collect the sample data.
- Regression Analysis: This is also a statistical inferential method used to model the relationship between dependent and independent variables. The main aim of regression analysis is to fit the mathematical equation of data, which defines the relationship between variables.
Inferential statistics accuracy highly depends on the sample data’s precision and how well it represents the entire population. Acquiring a random sample is an excellent way to accomplish this. The majority of the time, non-random sample-based results are disregarded. When using inferential techniques, random sampling is crucial despite not always being easy to execute.
Comparison Between (Infographic)
Below are the Top 10 comparisons between Descriptive and Inferential Statistics:
Key Differences
The differences between descriptive and inferential statistics lie as much in the process as in the statistics reported. Below are the key differences in descriptive vs. inferential statistics.
- When describing a scenario, we use descriptive statistics, while analyzing the likelihood event, we use inferential statistics.
- A specific population is explained using descriptive statistics using information that is already known. However, inferential statistics try to infer or draw conclusions about a complete population.
- For descriptive statistics, we utilize tables and charts. For inferential statistics, we employ probability approaches.
- Instead of inferential statistics, which require us to establish a relationship between variables across the entire population, we can conduct a study more easily using descriptive statistics.
Algorithm of Descriptive Statistics
Descriptive statistics algorithms contain the mathematical procedure that is used to describe the procedures. Below are the descriptive statistics algorithms as follows:
- Mean: It will measure the central tendency representing the average values.
- Median: It will measure the central tendency representing the middle value in the set of values.
- Mode: It will measure the central tendency that represents the value that frequently occurs.
- Range: It is the measure of dispersion that represents the difference between small and large values in the values set.
- Variance: It will measure dispersion representing the squared difference average from the mean.
- Percentiles: It measures dispersion that represents a value below a certain percentage.
- Standard deviation: It is the measure of dispersion representing the variance square root.
- Whisker and box plot: It is the graphical representation of the set of distributed values.
Algorithm of Inferential Statistics
Inferential statistics algorithms contain the mathematical procedure used to make predictions based on sample data. Below are the Inferential statistics algorithms as follows:
- Point Estimation: It is a statistical method that uses sample data to estimate the parameters of the population.
- Confidence Intervals: It contain the range of values that contain the true population with a certain degree.
- T-Test: The test algorithm determines the difference between two populations.
- Hypothesis: It is a statistical method that tests the validity of the population assumption that we made.
- Analysis of Variance: This hypothesis test determines the significant difference between means and two populations.
- Regression Analysis: This is a statistical method that models the relationship between dependent and independent variables.
- Bayesian Analysis: It is a statistical method that uses knowledge to update the population parameters.
- Logistic Regression: This is a statistical method that models the relationship between dependent and independent binary variables.
Comparison Table
The following table shows the comparison of Descriptive and Inferential Statistics:
| No. | Descriptive Statistics | Inferential Statistics |
| 1 | Descriptive statistics gives information about raw data. | It contains population inference. |
| 2 | Descriptive statistics help us to organize and analyze the data. | It will allow us to compare the data and make predictions and hypotheses. |
| 4 | Descriptive statistics are used to describe the situation. | Inferential statistics are used to explain the event’s occurrence. |
| 5 | Descriptive analysis will explain the known data. | Inferential statistics will attempt to reach the population conclusion. |
| 6 | Descriptive statistics is achieved with the help of tables, graphs, etc. | Inferential statistics is achieved by probability. |
| 7 | Descriptive statistics are used to summarize the data. | It will make the inference of a large population based on the sample. |
| 8 | Descriptive statistics do not contain assumptions about the population. | It will make assumptions about the population. |
| 9 | It will deal with the data that has been collected. | It will deal with the data collected in the future. |
| 10 | The goal of descriptive statistics is to describe and summarize the data. | The goal of inferential statistics is to test and make predictions. |
| 11 | The algorithm of descriptive statistics is mean, mode, and median. | The algorithm of inferential statistics is ANOVA and regression. |
Descriptive statistics are use
Uses of Descriptive Statistics
For the following purposes. There are multiple uses of descriptive statistics, as follows:
- Describe and summarize the data: Descriptive statistics provides an easy and quick way to summarize large sets of data to describe a feature of variability.
- Explore the data: Descriptive statistics helps us explore the data to better understand its specified structure.
Data Communication: Descriptive statistics presents data concisely and clearly. It will make it an easier way to interpret and understand the data. - Reduction of data: Descriptive statistics is used to reduce a large amount of data in a manageable form will make analysis easier.
Data Cleaning: Descriptive statistics will help us identify the errors or data missed from the dataset.
Uses of Inferential Statistics
Inferential statistics are used for the following purposes. There are multiple uses of inferential statistics, as follows:
- Hypothesis testing: Inferential statistics allow us to test the population based on sample data. It will help us to conclude larger populations.
- Estimate the population parameter: Inferential statistics are used to estimate the parameters of the population, such as mean and variances.
- Relationship evaluation: Inferential statistics are used to evaluate the significance and strength of the variable relationship.
Make predictions: Inferential statistics are used to predict future events or data. - Assessing Risk: Inferential statistics are used to assess the risk of the event which occurs on treatment effectiveness.
Group Comparison: Inferential statistics compare the groups and determine the differences.
Conclusion
A specific population is explained using descriptive statistics using information that is already known. However, inferential statistics try to infer or draw conclusions about a complete population. Inferential statistics draw inferences about the population using data extracted from the population.
Recommended Articles
This is a guide to Descriptive and Inferential Statistics. Here we discuss the definition, key differences, algorithm, comparison table, and uses. You can also look at the following articles to learn more –


