Updated September 12, 2023
What is Assumptions of Linear Regression
Linear regression is a statistical modeling method used to model the relationship between one or more independent variables (predictor variables) and dependent variables (response variable) of machine learning algorithms, which is the most straightforward to interpret.
It is a type of parametric Machine Learning Algorithms that makes assumptions for the data to make the model training process and model building faster and easier. Knowing the algorithms’ assumptions in machine learning is essential to make an accurate and reliable model.
Before directly jumping to the assumptions of linear regression, let us discuss linear regression.
Table of Content
Key Takeaways
- Linear regression is a widely used and easy-to-understand algorithm that works on the principle of the equation of a line.
- Linear regression is a type of parametric algorithm that assume certain assumptions of the data.
- The dataset to be fed to the model should be linear.
- There should be any correlation between the independent columns or variables of the dataset.
- There should be any autocorrelation between the model’s predicted values.
- The model’s predicted values should always follow a normal distribution.
- There should be homoscedasticity where the graph between error terms and predicted values should be homogeneous and constant.
What is Linear Regression?
Linear regression is a traditional statistical method that works on the principle of the equation of a line. It is one of the most accessible machine-learning algorithms that can be easily understood. In this algorithm, the equation of a line is used to recognize and solve the data patterns. The equation of the line is
We calculate the values of the coefficients; m and c from the data, and once we have the slope and intercept values, we can use the equation as a function. For any unknown value of the variable X, we can quickly get the value of Y accordingly.
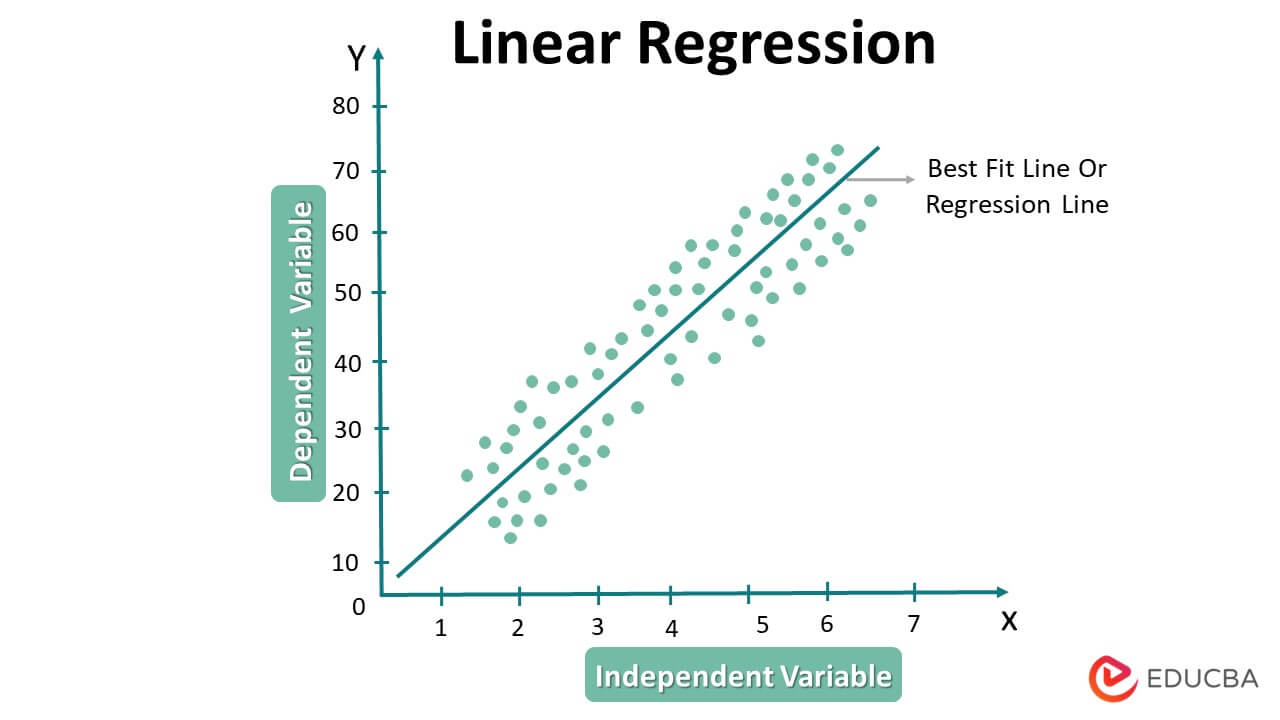
A linear regression graph typically shows a straight line representing the linear relationship between two variables, the independent variable, and the dependent variable. We plot the independent variable on the x-axis and the dependent variable on the y-axis.
The line on the graph represents the best-fit line, which minimizes the distance between the predicted values of the dependent variable and the actual values of the dependent variable.
Here is an example of a linear regression graph
In this graph, the independent variable is the number of hours studied, and the dependent variable is the exam score. The best-fit line is shown in a straight line and represents the linear relationship between the two variables. The line shows the predicted values of the dependent variable as dots on the line.
Linear regression is a parametric machine learning algorithm that makes predictions based on assumptions that they make on the data. Let’s discuss a bit about what parametric algorithms are.
What are Parametric Algorithms?
Mainly there are two types of machine learning algorithms based on their training behavior and their assumptions on the data. Parametric and Non Parametric.
The parametric algorithms are those which make certain assumptions on the training data. These algorithms use these assumptions to estimate the model parameters that best fit the data. Parametric algorithms are often faster to train and require fewer data than non-parametric algorithms, which do not make assumptions about the underlying distribution of the data. However, they can be less flexible and may not perform as well on data that does not conform to the assumed distribution.
Non-parametric algorithms are machine learning algorithms that do not make assumptions about the underlying distribution of the data. Instead, they rely on empirical data to estimate the relationships between variables and make predictions. Non-parametric algorithms can be more flexible and adaptable to a broader range of data than parametric algorithms and are often better suited to handling data with complex relationships between variables. However, they can also be slower to train and may require more data than parametric algorithms.
Now, let us discuss bout the assumptions of linear regression.
1. Linearity
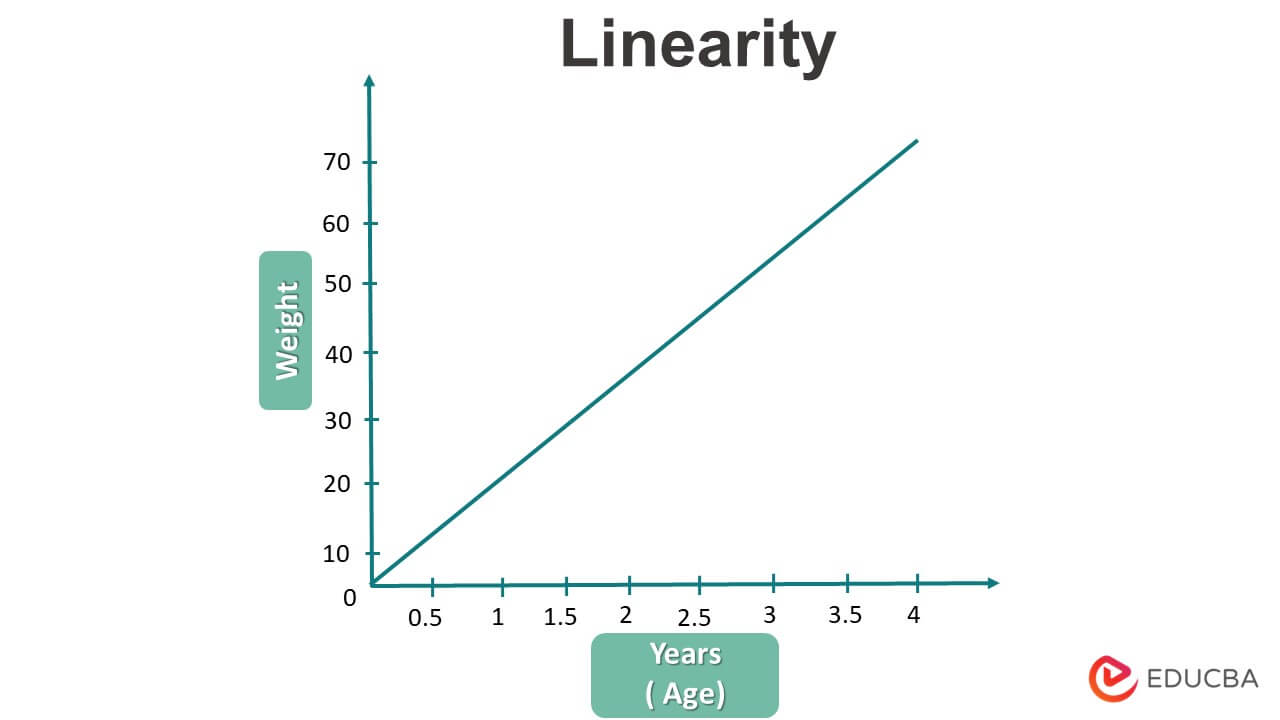
Linearity is the first and fundamental assumption of linear regression. As the name suggests, linear regression can only be helpful for the linear type of data. In the case of non-linear data, the algorithms lack some helpful information about the data and do not give reliable results.
The algorithms, before training, assume the data to be linear. If the dataset is not linear, then linear regression should not be used; in such cases, other machine learning algorithms like polynomial regression or neural networks can be used.
2. No Multicollinearity in the Data
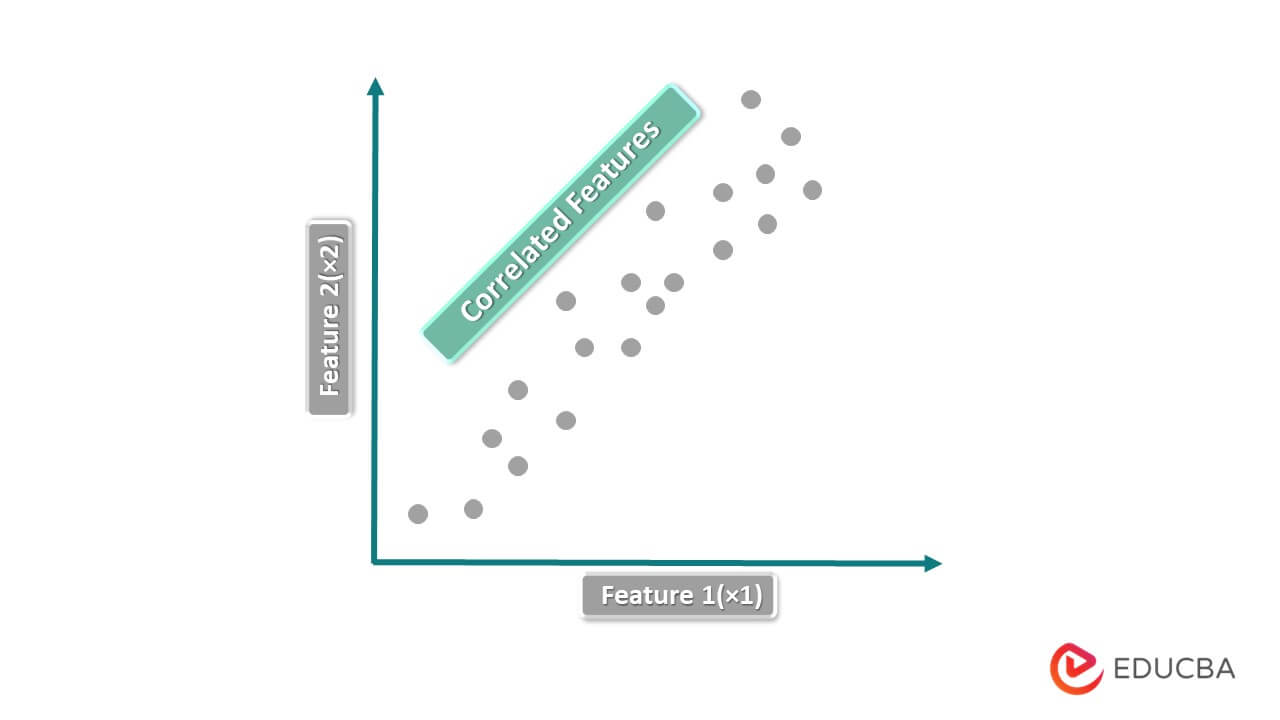
We use the term multicollinearity to denote the correlation between the independent columns in a dataset. In linear regression training, we treat the target variable as the dependent column and the independent variables as independent training features.
We use the concept of multicollinearity when there is a correlation between the independent columns or variables of the data. There should not be any multicollinearity homoscedasticity in the training dataset in case we use linear regression, as it assumes the independent columns or variables of the dataset are independent of each other.
3. Homoscedasticity in the Data
Homoscedasticity is a term in linear regression used to denote the graph of residual or error values vs. the fitted or predicted values. It refers to the graph or the variables between the residuals or the error terms. The scatterplot should not show any relation between the fitted or predicted terms. They should be constant.
Suppose the scatter plot between the residuals and the predicted values is not constant. In that case, we consider the model heteroscedastic, and the linear regression model does not accept it.
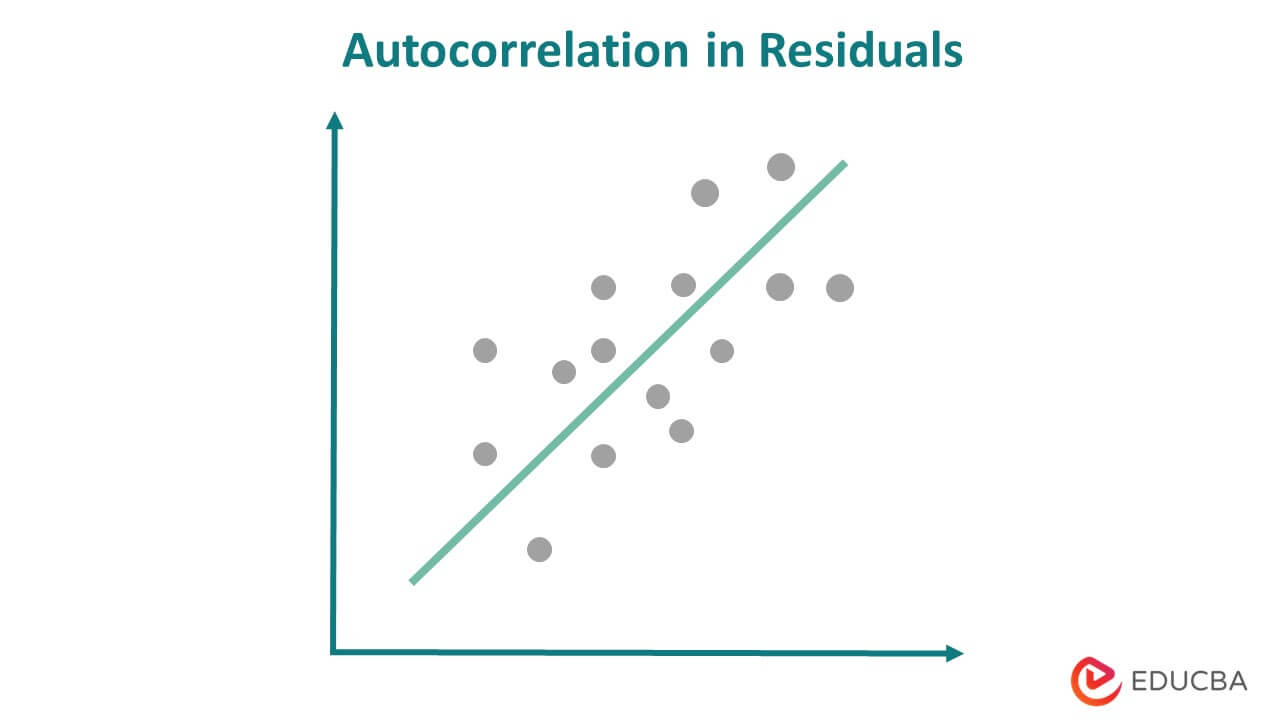
4. No Autocorrelation in Residuals
After training the model on the training data, we attempt to predict the unknown or unseen data using the model. The model assumes that there should not be any correlation between the predicted or the output terms.
As we can see in the above image, the predicted value has some correlation, and another predicted value influences the value of one predicted value. This situation should not arise in the case of linear regression.
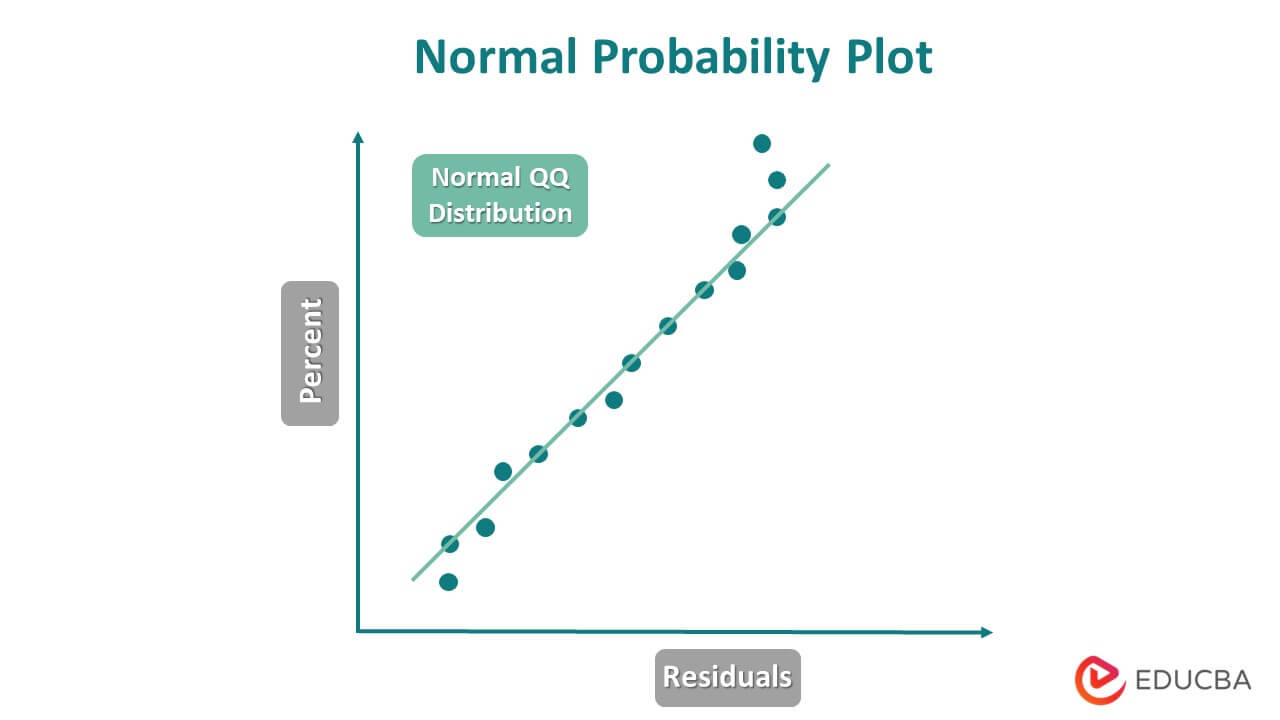
5. Residuals are Distributed Normally
After training the model, you feed the test data to it for prediction, and the model produces predictions for each test observation. When the model produces predicted values, it generates residual values that serve as the error terms. These residuals should be normally distributed.
If the residuals are not following the normal distribution, there is some error while training the model, or any assumptions are not satisfied.
Making Predictions with Linear Regression
Step 1: Importing Required Libraries
import numpy as np
import pandas as pd
from sklearn.linear_model import LinearRegression
Step 2: Loading the Dataset
data = pd.DataFrame({
'x': np.arange(10),
'y': np.array([1, 2, 3, 4, 5, 6, 7, 8, 9, 10])
})
Step 3: Split the Dataset
X = data[['x']]
y = data['y']
Step 4: Linear Regression Model
model = LinearRegression()
model.fit(X, y)
Step 5: Making Predictions
X_new = np.array([[10], [11], [12]])
y_new = model.predict(X_new)
print(y_new)
Step 6: Visualization
# Plot the data and the prediction result
plt.figure(figsize=(8,6))
plt.scatter(X, y, color='blue')
plt.plot(X_new, y_new, color='red', linestyle='--')
plt.title('Linear Regression Prediction')
plt.xlabel('X')
plt.ylabel('y')
plt.show()
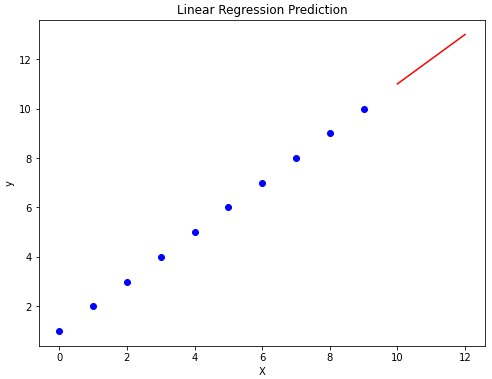
Output:
What to Do if any Assumptions of Linear Regression are Violated?
There are several ways to handle if any assumptions of linear regression are violated.
- Detect and Handle Outliers: outliers can cause violation of linear regression assumptions; check for them and handle them.
- Check Multicollinearity: Try to detect multicollinearity in the dataset, and if present, try removing one of the correlated features from the dataset.
- Data Transformation: several data transformation techniques transform the data into its normal distribution. Use a function or power transformer for converting the data.
- Use any Other Model: If still, the model is not working well, you can try using any other regression model, which is non-parametric and robust.
Examples of Real-Life Situations
- If we want to predict any person’s income using the person’s age, we can use linear regression as there will be almost linear data, and linear regression can perform better.
- If you want to get the relationship between the person’s weight and height, we can use a linear regression model as the residuals here, in this case, would be normally distributed.
- When features are entirely independent of one another, such as a person’s height and wealth, linear regression can be applied.
- If we want to predict the crop yield based on the amount of fertilizer applied, we can use linear regression as the data here will be homoscedastic.
Limitations of Linear Regression
Here are some common limitations of linear regression:
- Linearity assumption: Linear regression predicts a linear relationship between the dependent variables (also called response variable or outcome variable) and the independent variable (also called predictor variables or explanatory variables). If the relationship is non-linear, linear regression may not provide accurate predictions.
- Outliers: Linear regression is sensitive to outliers, which can significantly impact the model’s fit. Outliers can distort the regression line and cause the model to provide inaccurate predictions.
- Multicollinearity: Linear regression can encounter issues when there is a high correlation between two or more independent variables, leading to multicollinearity and making it difficult to discern the true impact of each independent variable on the dependent variable.
- Overfitting: If there are many independent variables or the model is too complex, the model may be overfitting to the data. This means the model fits the training data well but does not generalize to new data.
- Non-constant variance: The assumption of homoscedasticity (constant variance) may sometimes not hold, leading to incorrect standard errors and confidence intervals.
- Causality: Linear regression can only establish associations between variables, not causality. Therefore, it is essential to be cautious when interpreting the results of a linear regression analysis.
- Limited applicability: Linear regression may not be appropriate for all types of data or research questions. For example, it may not be suitable for categorical variables or variables with a non-linear relationship with the dependent variable.
Conclusion
People widely use linear regression as a statistical technique to predict the relationship between independent and dependent variables. However, it is essential to consider the assumptions of linear regression, which include linearity, independence, homoscedasticity, normality, and the absence of multicollinearity. Violations of these assumptions can result in inaccurate predictions or biased parameter estimates. It is also essential to consider the limitations of linear regression, such as its sensitivity to outliers and its inability to establish causality. By being mindful of these assumptions and limitations, researchers can apply linear regression to real-life situations.
Recommended Articles
We hope that this EDUCBA information on “Assumptions of Linear Regression” was beneficial to you. You can view EDUCBA’s recommended articles for more information,

