Introduction to Market Basket Analysis in Data Mining
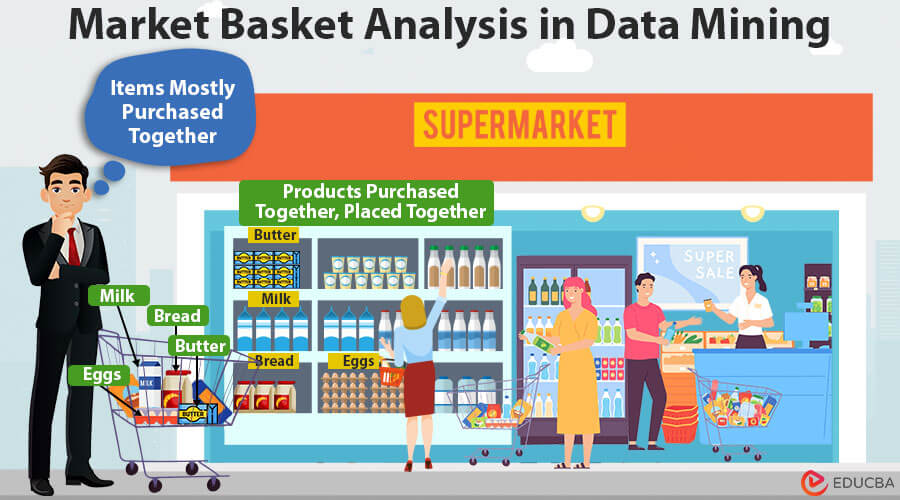
Have you ever wondered how online retailers like Amazon seem to magically know what products to recommend to you? Or how supermarkets strategically place certain items next to each other to increase sales? The answer lies in a fascinating field of data mining known as Market Basket Analysis (MBA).
Market Basket Analysis, a pivotal technique in data mining, unveils hidden patterns within customer transactions. Analyzing frequently bought-together items unlocks consumer behavior secrets for businesses. This data-driven approach empowers retailers to strategically position products, implement effective cross-selling tactics, and tailor marketing efforts. As a result, Market Basket Analysis enhances the shopping experience, fosters targeted promotions and boosts revenue through a more informed and customer-centric approach.
Table of Contents
Key Takeaways
- It identifies relationships between products based on consumer transactions.
- It reveals hidden trends in consumer behavior and provides information for cross-selling and intelligent product placement.
- It improves promotions and targeted marketing.
- It gives essential insights into the patterns and preferences of customers.
- It enhances the shopping experience and allows companies to make data-driven decisions by optimizing sales methods.
Association Rule in MBA
In Market Basket Analysis (MBA), association rules are logical connections in transactional data that suggest a product’s likelihood of being bought by another. These rules include antecedents (products in the basket) and consequents (things likely to be purchased with antecedents). Metrics such as lift, support, and confidence quantify these rules. Strong associations show high-confidence rules, which help companies with focused marketing, cross-selling, and strategic product placement to improve overall sales strategy.
Example:
Transaction Data:
- Transaction 1: {Bread, Milk, Eggs}
- Transaction 2: {Bread, Butter}
- Transaction 3: {Milk, Eggs, Butter}
- Transaction 4: {Bread, Milk}
Association Rule:
The association rule we’re exploring is: “Customers are more likely to purchase eggs if they purchase milk and bread.”
Analysis:
1. Support:
- Support tells us how frequently a specific combination of items occurs in transactions.
- We calculate the support for the association rule:
- Support(Bread ∪ Milk → Eggs)=Total transactionsTransactions containing Bread, Milk, and Eggs/Total Transactions
- In our case, out of 4 total transactions, only 1 transaction (Transaction 1) contains Bread, Milk, and Eggs.
- Therefore, the support for this association rule is 1/4=0.25, indicating that in 25% of transactions, Bread, Milk, and Eggs are bought together.
2. Confidence:
- Confidence measures the probability that purchasing Bread and Milk together implies purchasing Eggs.
- We calculate the confidence for the association rule:
- Confidence(Bread ∪ Milk → Eggs) = Support(Bread ∪ Milk → Eggs)/ Support(Bread ∪ Milk)
- Of the three transactions containing Bread and Milk (Transactions 1, 3, and 4), only one transaction (Transaction 1) also includes Eggs.
- Therefore, the association rule has a confidence of approximately 0.33, indicating that when customers purchase Bread and Milk together, there’s a 33% chance they will also buy Eggs.
3. Lift:
- Lift measures the strength of association between items by considering how likely customers are to buy them together compared to if purchased independently.
- We calculate the lift for the association rule:
- Lift(Bread ∪ Milk → Eggs) = Support(Bread ∪ Milk → Eggs)/Support(Bread ∪ Milk)×Support(Eggs)
- The support for Eggs is 2/4=0.5, as Eggs appear in 2 out of 4 transactions.
- Therefore, the lift for this association rule is calculated as 0.25/0.75*0.5, indicating that the association between Bread, Milk, and Eggs is 0.67 times more likely than if customers made purchases independently.
Conclusion:
This detailed analysis provides insights into the frequency, probability, and strength of association between Bread, Milk, and Eggs in customer transactions. Businesses transform customer insights into strategic actions, placing products strategically, crafting targeted promotions, and designing powerful marketing campaigns.
Working of MBA
Market Basket Analysis finds the co-occurrence of items in purchases by examining transactional data. To collect data, take the following actions: First, gather transactional data by using invoices, sales receipts, or any other documentation proving the products that customers have bought.
Data Preprocessing: The data preprocesses the collected data to put it in an analysis-ready state. In this phase, it cleans the data, handles any missing values, and converts it into a transactional format where each transaction lists the goods a client has purchased.
Association Rule Generation: Association rule mining is central to Market Basket Analysis. This method finds connections between products that appear together in transactions regularly. The most often utilized algorithm for this purpose is the Apriori algorithm.
Support, Confidence, and Lift:
We assess the extracted rules using three essential indicators.
Support: Shows how frequently a specific combination of elements appears in the transactions.
Confidence: Calculates the probability that a client purchasing one product will also purchase another related goods.
Lift: Determines the strength of the link by comparing the likelihood of two products occurring together, each occurring separately.
Rule Evaluation: Evaluate the created rules for significance and utility using lift, confidence, and support measures.
Application of Insight: Various areas can benefit from using the generated insights to make informed decisions, such as
- Product placement optimization.
- Targeted marketing strategies.
- Cross-selling and upselling opportunities.
- Inventory management improvements.
By following these procedures, Market Basket Analysis offers valuable insights into consumer behavior and helps organizations make data-driven decisions.
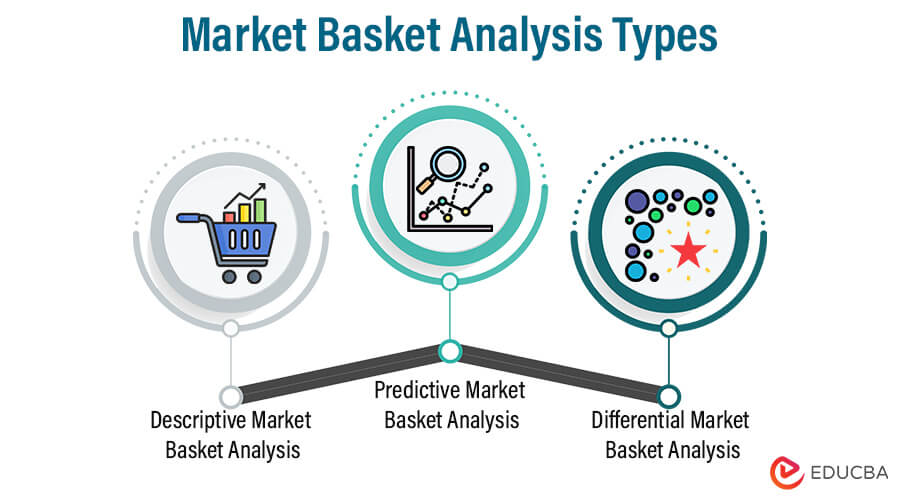
MBA Types
- Descriptive Market Basket Analysis:
Without forecasting, descriptive market basket analysis looks into historical data to find product relationships. This study uses statistical approaches to measure the strength of relationships based on past transactions. For example, it might disclose that consumers usually buy peanut butter and jelly together, offering insightful information without forecasting future purchases. In data analysis, experts classify this method as unsupervised learning.
- Predictive Market Basket Analysis:
Conversely, predictive market basket analysis uses supervised learning models like regression and classification to forecast future events based on past data. This analysis examines item purchase sequences to predict future behavior, find cross-selling opportunities, and evaluate potential market developments. For instance, estimating the likelihood that buyers of new phones will also likely purchase accessories or extended warranties. Businesses can model and understand market behavior with this method to make analytical forecasts.
- Differential market basket analysis:
Differential Market Basket Analysis proves beneficial for competitor analysis, comparing purchase patterns across various factors. This type of analysis scrutinizes purchase history between different stores, seasons, periods, or days of the week, aiming to unearth significant patterns in consumer behavior. For instance, it could help businesses understand why certain users prefer buying the same product on Amazon over Flipkart, considering factors like delivery speed or user experience. This approach provides valuable insights into the reasons behind varying consumer choices under different circumstances, aiding businesses in refining their strategies.
Data Preparation and Preprocessing
The data preparation and preprocessing process for market basket analysis is illustrated using a simple example. In this example, we will use a hypothetical online retail dataset where each transaction represents items purchased by a customer.
Code:
import pandas as pd
from mlxtend.preprocessing import TransactionEncoder
from mlxtend.frequent_patterns import apriori, association_rules
# Example Dataset
transactions = [
    ['laptop', 'mouse', 'keyboard'],
    ['laptop', 'mouse', 'backpack'],
    ['mouse', 'headphones', 'mouse pad'],
    ['laptop', 'keyboard', 'mouse pad'],
    ['headphones', 'mouse pad', 'external hard drive'],
    ['laptop', 'mouse', 'keyboard', 'mouse'],  # Duplicate item
    ['laptop', 'mouse', 'mouse pad'],         # Duplicate item
    ['laptop', 'keyboard', 'mouse pad', 'camera'],
    []  # Empty transaction
]
# Data Cleansing Step: Remove Duplicates and Empty Transactions
transactions = [list(set(transaction)) for transaction in transactions if len(transaction) > 0]
print (transactions)
# Handling Missing Values: Treat missing items as not present
transactions = [[item if pd.notna(item) else 'NSotPresent' for item in transaction] for transaction in transactions]
# Data Preparation: One-Hot Encoding
encoder = TransactionEncoder()
onehot = encoder.fit(transactions).transform(transactions)
df = pd.DataFrame(onehot, columns=encoder.columns_)
print(df)
# Data Preprocessing: Removing Redundant or Infrequent Items
# In this example, let's assume 'camera' is too infrequent and should be removed
df = df.drop(columns=['camera'], errors='ignore')
print(df)
# Market Basket Analysis: Generating Frequent Itemsets
frequent_itemsets = apriori(df, min_support=0.2, use_colnames=True)
print(frequent_itemsets)
# Market Basket Analysis: Generating Association Rules
association_rules_df = association_rules(frequent_itemsets, metric="confidence", min_threshold=0.5)
# Display the results
print("Cleansed and Preprocessed Dataset:")
print(df)
print("\nFrequent Itemsets:")
print(frequent_itemsets)
print("\nAssociation Rules:")
print(association_rules_df)
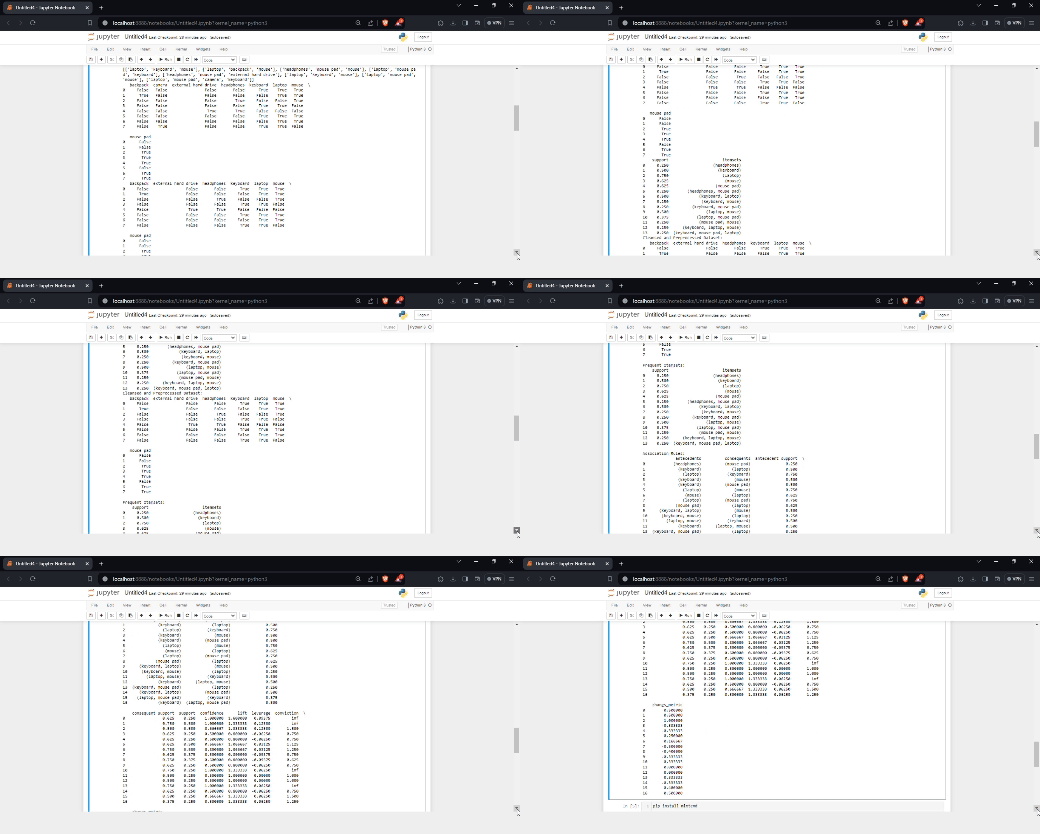
Output:
Explanation:
This code performs the following steps:
Step 1: Handling Duplicates:
- Identify and remove duplicate transactions or items. It helps maintain the integrity of the analysis.
Example:
Remove Transaction 6 and Transaction 7 as they contain duplicate items.
# Data Cleansing Step: Remove Duplicates and Empty Transactions
transactions = [list(set(transaction)) for transaction in transactions if len(transaction) > 0]
print(transactions)
Step 2: Handling Missing Values:
- Remove transactions with missing or empty values to ensure the dataset’s quality.
Example:
Remove Transaction 9 as it is an empty transaction.
# Handling Missing Values: Treat missing items as not present
transactions = [[item if pd.notna(item) else 'NotPresent' for item in transaction] for transaction in transactions]
Step 3: One-Hot Encoding:
Convert the cleansed transaction data into a one-hot encoded format.
# Data Preparation: One-Hot Encoding
encoder = TransactionEncoder()
onehot = encoder.fit(transactions).transform(transactions)
df = pd.DataFrame(onehot, columns=encoder.columns_)
print(df)
Step 4: Removing Redundant or Infrequent Items:
Analyze the cleansed data to identify and remove items that are too frequent or infrequent.
# Data Preprocessing: Removing Redundant or Infrequent Items
# In this example, let's assume 'camera' is too infrequent and should be removed
df = df.drop(columns=['camera'], errors='ignore')
print(df)
Example (Continued):
- Suppose we identify that the camera is too infrequent; it may be removed in this step.
Step 5: Generating Frequent Itemsets:
Apply the Apriori algorithm or other association rule mining techniques to identify frequent itemsets based on a specified minimum support threshold.
# Market Basket Analysis: Generating Frequent Itemsets
frequent_itemsets = apriori(df, min_support=0.2, use_colnames=True)
print(frequent_itemsets)
Step 6: Generating Association Rules:
From the frequent itemsets, generate association rules based on user-defined metrics such as confidence and lift.
# Market Basket Analysis: Generating Association Rules
association_rules_df = association_rules(frequent_itemsets, metric="confidence", min_threshold=0.5)
# Display the results
print("\nAssociation Rules:")
print(association_rules_df)Algorithms
Several techniques are used in Market Basket Analysis (MBA) to find relationships and trends in transactional data. The following are two well-liked market basket analysis algorithms:
1. Apriori Algorithm:
Data mining employs the Apriori algorithm to identify frequent itemsets and association rules within extensive datasets. This method functions by iteratively producing candidate itemsets, calculating their support, and deriving association rules from frequent itemsets. This iterative process continues until it identifies no new frequent itemsets. The algorithm widely uses market basket analysis, pattern discovery, optimization of inventory management, and personalized recommendation systems.
Steps:
Generate candidate itemsets: Start with frequent itemsets of size 1 (single items) and use the Apriori property (a set must be frequent if all subsets are frequent) to repeatedly build more significant candidate itemsets.
Prune infrequent itemsets: Eliminate candidate itemsets that don’t have the required amount of support.
Parameters:
Generate association rules: Create association rules with predetermined confidence and lift thresholds using the frequently occurring itemsets.
Minimum support: The least amount of times an itemset must occur to be deemed frequent.
Minimum confidence: The association rules’ minimal level of confidence.
2. FP-Growth(Frequent Pattern Growth)Algorithm:
The FP-Growth algorithm efficiently extracts frequent itemsets from large datasets. This is achieved by creating an FP tree and recursively investigating conditional pattern bases. Unlike conventional approaches such as Apriori, FP-Growth only requires two scans of the dataset, resulting in improved efficiency and scalability, particularly for sparse datasets. It boasts reduced memory requirements and faster processing, contributing to its popularity for association rule mining tasks.
Steps:
Construct the FP-tree: Make a tree structure to symbolize the dataset’s frequently occurring itemsets.
Mine frequent itemsets: Without producing candidate itemsets, traverse the FP-tree to directly identify frequently occurring itemsets.
Generate association rules: Create association rules with predetermined confidence and lift thresholds using the frequently occurring itemsets.
Key metrics and terms in MBA
Market Basket Analysis (MBA) use important metrics and phrases to assess the importance and strength of association rules. The following are some crucial terminology and metrics:
- Support:
Support calculates the frequency of a specific combination of products purchased together, calculated as the proportion of transactions in which the items co-occur, expressed mathematically as
Formula: Total transactionsSupport(X)=Total transactionsTransactions containing X / Total Transaction
- Confidence:
Confidence quantifies the probability that item B will be purchased if a customer buys item A. It computes the ratio of transactions containing A that includes B. In mathematical terms:
Formula:
Confidence(X⇒Y)=Support(X∪Y)/Support(X)
Confidence ranges from 0 to 1, where 1 indicates a perfect correlation between items.
- Lift:
Lift is a metric that quantifies the degree of correlation between two items by considering the frequency at which they occur together with the frequency at which they occur separately. It computes as follows:
Formula:
Lift(X⇒Y)=Support(X∪Y)/Support(X)×Support(Y)
A lift more significant than 1 indicates a positive correlation between the items, a lift equal to 1 indicates independence and a lift less than 1 indicates a negative correlation.
- Conviction:
Measures the dependence of Y on X, representing how much more likely X implies Y than if they were independent.
Formula:
Conviction(X⇒Y)=1−Support(Y)/1−Confidence(X⇒Y)
High conviction values suggest a strong relationship between items.
Antecedent and Consequent:
- Antecedent (X): The itemset appearing before the arrow in the association rule (X => Y).
- Consequent (Y): The itemset appearing after the arrow in the association rule (X => Y).
Association Rule:
These rules are generated from Market Basket Analysis and represent connections between items using “if-then” statements. For instance, “If item A is bought, then item B is also probable to be bought.”
- Frequent Itemset: These itemsets often occur together in transactions exceeding a defined support threshold. They serve as the foundation for generating association rules.
- Apriori Algorithm: The Apriori Algorithm is widely used to identify frequent items and association rules in market basket analysis. It operates by progressively identifying frequent itemsets of increasing size.
- Basket Size: Basket size indicates the number of items bought in a transaction. Understanding the typical basket size can assist retailers in optimizing their product offerings and promotions.
- Cross-selling: Cross-selling recommends related or complementary products to customers based on their current purchases. Market Basket Analysis helps identify appropriate cross-selling opportunities.
- Upselling: Upselling entails encouraging customers to opt for a more premium product offering. Market Basket Analysis can uncover patterns that indicate opportunities for upselling.
Benefits of MBA
Cross-Selling Opportunities: Cross-selling entails proposing supplementary products or services to customers according to their present purchase. Businesses can pinpoint commonly associated products by examining customers’ buying history patterns. For example, if customers frequently buy bread and eggs concurrently, a grocery store could strategically position these items near each other or provide a discount for purchasing them together. It not only boosts sales but also elevates the overall shopping experience for customers.
Inventory Management: Businesses can improve their inventory management processes by analyzing which items customers often buy together. By keeping popular combinations well-stocked, businesses can avoid running out of stock and ensure that in-demand products are consistently accessible to customers. Understanding what gets bought together empowers strategic store design, positioning complementary products for maximum temptation.
Enhanced price tactics: Effective inventory management involves analyzing which items are frequently purchased together. By identifying these popular combinations, businesses can maintain adequate stock levels to prevent shortages and ensure a seamless shopping experience for customers. Moreover, leveraging this knowledge allows businesses to arrange store product displays strategically, placing complementary items nearby to encourage additional purchases. This tactic enhances sales and improves the overall shopping experience, as customers find it easier to locate and purchase related products. Additionally, businesses can use this information to adjust pricing strategies, such as offering discounts on complementary items or bundling them together for a better value proposition, further driving sales and customer satisfaction.
Improved Product Placement: Using association rules to strategically arrange products within retail stores strategically can substantially impact sales and customer satisfaction. Understanding buying habits allows for targeted product adjacencies, enhancing the shopping experience by suggesting perfect matches at the right moment. For example, positioning salsa next to tortilla chips or batteries next to electronic devices can result in higher sales and improved customer satisfaction.
Personalized Recommendations: Market basket analysis unlocks buying patterns, enabling businesses to suggest relevant products like a personal shopping assistant. By utilizing data on product correlations, companies can propose additional items likely to appeal to individual customers. It improves the shopping experience and boosts the chances of repeat purchases and customer loyalty. Personalized recommendations can be communicated through various channels, including email marketing, online suggestions, or in-store displays, further enriching the customer experience.
Examples:
Let’s consider a simple example of Market Basket Analysis in a retail setting using a hypothetical dataset. Imagine a dataset that records transactions in a grocery store, where each transaction lists the items purchased by a customer. The goal is identifying associations between items to inform marketing and sales strategies.
Sample Dataset:
| Transaction ID | Items Purchased |
| 1 | Bread, Milk |
| 2 | Bread, Eggs |
| 3 | Milk, Eggs |
| 4 | Bread, Milk, Eggs |
| 5 | Bread, Butter |
| 6 | Butter, Jam |
| 7 | Bread, Milk, Jam |
| 8 | Eggs, Jam |
| 9 | Milk, Jam |
| 10 | Bread, Eggs, Jam |
1. Association Rule 1: Bread => Milk
- Support(Bread => Milk):
Number of transactions containing both Bread and Milk = 4 (transactions 1, 4, 7, 10)
Total number of transactions = 10
Support(Bread→Milk)=4/10=0.4
- Confidence(Bread => Milk):
Number of transactions containing both Bread and Milk = 4 (transactions 1, 4, 7, 10)
Number of transactions containing Bread = 6 (transactions 1, 2, 4, 5, 7, 10)
Support(Bread)=6/10=0.6
Confidence(Bread→Milk)=0.4/ 0.6=0.6667
So, the calculated support for the association rule “Bread => Milk” is 40% (0.4), and the confidence is 66.7% (0.6667), which matches the given values.
2. Association Rule 2: Bread, Milk => Eggs
- Support(Bread, Milk => Eggs):
Number of transactions containing Bread, Milk, and Eggs = 1 (transaction 4)
Total number of transactions = 10
Support(Bread,Milk→Eggs)=> 1/10=0.1
- Confidence(Bread, Milk => Eggs):
Number of transactions containing Bread, Milk, and Eggs = 1 (transaction 4)
Number of transactions containing Bread and Milk = 4 (transactions 1, 4, 7, 10)
Support(Bread,Milk)=4/10=0.4
Confidence(Bread,Milk→Eggs)=0.1/0.4=0.25
So, the calculated support for the association rule “Bread, Milk => Eggs” is 10% (0.1), and the confidence is 25% (0.25), which matches the given values.
3. Association Rule 3: Butter => Jam
- Support(Butter => Jam):
Number of transactions containing both Butter and Jam = 2 (transactions 6, 7)
Total number of transactions = 10
Support(Butter→Jam)=>2/10=0.2
- Confidence(Butter => Jam):
Number of transactions containing both Butter and Jam = 2 (transactions 6, 7)
Number of transactions containing Butter = 2 (transactions 5, 6) Support(Butter)=>2/10=0.2
Confidence(Butter→Jam)=>0.2/0.2=1
So, the calculated support for the association rule “Butter => Jam” is 20% (0.2), and the confidence is 100% (1), which matches the given values.
Visualization graphs
1. Directed Graph
The graph visually represents the discovered association rules, offering insights into item associations and potential purchasing patterns in the dataset.
# Visualization: Create a Graph of Association Rules
G = nx.DiGraph()
for index, rule in association_rules_df.iterrows():
    G.add_edge(rule['antecedents'], rule['consequents'], weight=rule['support'])

# Draw the graph
pos = nx.spring_layout(G)
labels = nx.get_edge_attributes(G, 'weight')
nx.draw(G, pos, with_labels=True, node_size=700, node_color="skyblue", font_size=10, font_color="black")
nx.draw_networkx_edge_labels(G, pos, edge_labels=labels)
plt.title("Market Basket Analysis - Association Rules")
plt.show()
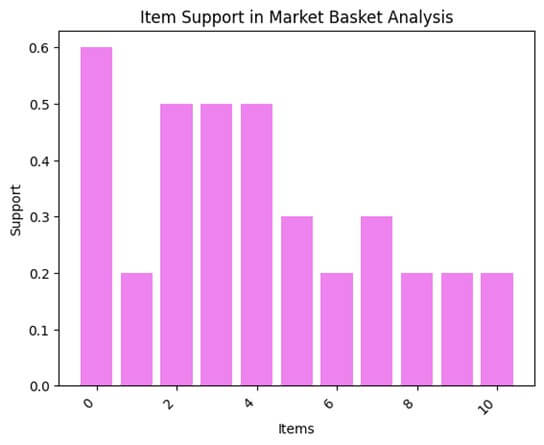
2. Bar Graph:
To visualize the support of each item in the given dataset, we can create a bar graph. The height of each bar represents the support of the corresponding item. Here’s a modified code snippet to include the bar graph:
# Visualization: Bar Graph of Item Support
item_support = frequent_itemsets.support.sort_values(ascending=False)
plt.bar(item_support.index, item_support.values, color='violet')
plt.xlabel('Items')
plt.ylabel('Support')
plt.title('Item Support in Market Basket Analysis')
plt.xticks(rotation=45, ha='right')
plt.show()
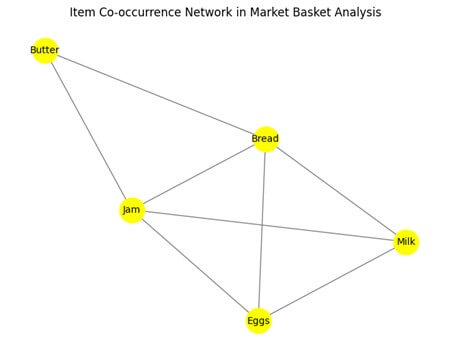
3. Network Graph
This network graph represents the relationships between items in the transactions. Each node in the graph represents an item, and edges connect items that co-occur in transactions. The edges’ thickness or color can indicate the association’s strength.
# Create a Network Graph
G = nx.Graph()

# Add edges to the graph based on item co-occurrences in transactions
for transaction in transactions:
    for item1 in transaction:
        for item2 in transaction:
            if item1 != item2:
                G.add_edge(item1, item2)

# Draw the Network Graph
pos = nx.spring_layout(G)
nx.draw(G, pos, with_labels=True, font_size=10, node_size=700, node_color="yellow", font_color="black", edge_color='gray')
plt.title('Item Co-occurrence Network in Market Basket Analysis')
plt.show()
Business Implications:
- The store may run specials or discounts for consumers who purchase milk and bread together to boost sales of both products.
- Since people usually buy bread and milk together, selling eggs and these products could increase sales even further.
- Making exclusive deals available to consumers who purchase Butter and Jam could boost sales of these complimentary goods.
Applications
Cross-Selling and Upselling:
MBA helps identify products commonly bought in tandem. Companies can utilize this data to apply cross-selling tactics, suggesting relevant products to clients at the time of purchase. Additionally, it facilitates upselling by recommending supplementary or higher-end items.
Inventory Management:
Retailers can optimize their inventory by understanding item associations. It allows them to stock related products nearby, ensuring that popular combinations are readily available, reducing stockouts, and enhancing customer satisfaction.
Fraud Detection:
Market Basket Analysis applies to detecting unusual patterns or combinations of items in transactions, which may indicate fraudulent activities. Identifying outliers and irregularities can help in preventing and mitigating fraud.
E-commerce Personalization:
Online retailers personalize the shopping experience through MBA-powered recommendations, driving customer engagement and boosting sales. It enhances customer engagement and increases the chances of successful transactions.
Supply Chain Optimization:
Understanding item relationships can make The supply chain more efficient. Market Basket Analysis identifies demand patterns manufacturers and distributors can use to modify production and distribution procedures.
Advantages and Disadvantages of Market Basket Analysis
| Advantages | Disadvantages |
| Identify meaningful associations and patterns within transactional data. | It relies on transactional data, which may only capture some relevant information in certain scenarios. |
| Helps businesses make informed decisions for product placement, promotions, and inventory management. | MBA may not capture the broader context of customer behavior, limiting its scope in certain situations. |
| Enables targeted marketing campaigns based on customer segments and preferences. | Some associations may be complex and challenging to interpret, requiring domain knowledge for meaningful insights. |
| It can contribute to fraud detection by identifying irregular item combinations in transactions. | The computational complexity of analyzing all possible item combinations may pose scalability challenges for large datasets. |
| Provides a cost-effective way to target promotions by focusing on high-impact product combinations. | Analyzing transactional data raises privacy concerns, necessitating careful handling of customer information. |
| Offers real-time insights for immediate decision-making in areas like promotions and product recommendations. | Implementing and maintaining an effective Market Basket Analysis system may require specialized expertise. |
Challenges and Considerations:
- Data Quality:
- Incomplete Data: Inaccuracies or missing entries in transactional data can lead to incomplete patterns, impacting the reliability of association rules.
- Scale and Complexity:
- Large Datasets: Processing extensive datasets can be computationally demanding, requiring efficient algorithms to handle the scale of transactions for meaningful analysis.
- Complex Associations: Identifying subtle and complex item associations becomes challenging as the dataset grows, potentially leading to spurious results.
- Sparsity:
- Sparse Data: In scenarios where transactions involve a vast product catalog, the data may be sparse, making identifying significant associations and patterns difficult.
- Privacy Concerns:
- Individual Identifiability: Analyzing transactional data may raise privacy concerns, necessitating careful handling of customer information to avoid individual identifiability.
- Data Anonymization: Ensuring data anonymization is crucial to protect customer privacy, but this process may introduce noise and impact the accuracy of results.
- Dynamic Markets:
- Changing Trends: Markets evolve, and rapidly changing consumer preferences may render historical association rules less relevant. Continuous adaptation is essential.
- Seasonal Variations: Market Basket Analysis may need to account for seasonal fluctuations and variations in purchasing behavior.
- Interpretability:
- Complex Rules: Highly intricate association rules may be challenging to interpret, requiring domain knowledge to extract meaningful insights.
- Business Relevance: Ensuring that identified associations have practical significance and align with business goals is crucial for actionable insights.
- Overfitting:
- Overfitting Issues: Overfitting can occur when association rules are tailored too closely to the training data, leading to less generalizable patterns.
- Validation Techniques: Robust validation techniques are necessary to identify and mitigate overfitting issues.
- Algorithm Selection:
- Choosing the Right Algorithm: Selecting appropriate algorithms for association rule mining, such as Apriori or FP-growth, involves considering the dataset characteristics and the desired level of granularity.
- Scalability: Some algorithms may need help with scalability issues when dealing with large datasets, requiring careful consideration of computational resources.
- Contextual Factors:
- Ignoring Context: Please consider contextual factors such as time, location, or external events to ensure accurate association rules.
- Dynamic Environments: Adapting MBA to dynamic environments requires continuous monitoring and adjustments to remain relevant.
- Actionability:
- Translating Insights into Actions: Ensuring that the insights gained from Market Basket Analysis are actionable and can effectively integrate into business strategies.
- Implementation Challenges: Businesses may face challenges in implementing changes based on MBA insights, requiring alignment with operational processes.
Advanced Techniques and Improvements
Market Basket Analysis (MBA) has evolved, and experts have developed several advanced techniques and improvements to enhance its effectiveness. Here are some advanced techniques and improvements in Market Basket Analysis:
Association Rule Strength Metrics:
Consider utilizing more sophisticated metrics like Lift, Jaccard coefficient, and conviction rather than solely depending on conventional support and confidence measurements. They offer a more sophisticated comprehension of the connections among the objects.
Sequential Pattern Mining:
To uncover what items customers purchase together and the order in which they buy them, you can explore sequential transaction patterns instead of relying on traditional association rules. Algorithms such as PrefixSpan and GSP (Generalized Sequential Pattern) can be helpful for this purpose.
Online and Real-time Analysis:
Consider adopting market basket analysis for real-time applications in today’s fast-paced world. You can find online algorithms that update association rules dynamically as new data arrives, which can be particularly useful.
Handling Large Datasets:
Scalability becomes crucial as datasets grow.
For massive datasets, crack the code with parallel processing, distributed computing, or market basket analysis-specific algorithms.
Visualization Techniques:
Advanced visualization techniques can enhance the interpretability of your results. Stakeholders can grasp complex patterns more easily with the help of heatmaps, network graphs, and interactive dashboards.
Conclusion
Data mining techniques like Market Basket Analysis can enable firms to understand their customers’ interests better and adjust their sales strategy. By revealing hidden relationships in transactional data, these techniques assist in making more informed decisions that enhance profitability and improve customer satisfaction. Moreover, they enhance inventory management and facilitate targeted marketing.
Frequently Asked Questions
Q1. What challenges are associated with Market Basket Analysis?
Answer: Challenges include:
- Managing large datasets.
- Ensuring data security and privacy.
- Correcting erroneous correlations.
- Guaranteeing the applicability and correctness of results.
Additionally, domain expertise is necessary to derive significant insights from interpreting association rules.
Q2. How is Market Basket Analysis different from Collaborative Filtering?
Answer: Recommendation systems use both approaches, where Collaborative Filtering suggests goods based on user preferences and similarity to other users, while Market Basket Analysis concentrates on item correlations within transactions.
Q3. Can businesses use Market Basket Analysis for real-time decision-making?
Answer: While traditional MBA may require batch processing, real-time adaptations and extensions of the technique, such as streaming Market Basket Analysis, are emerging to enable more timely decision-making in dynamic business environments.
Q4. Are there ethical considerations in Market Basket Analysis, particularly regarding customer privacy?
Answer: Yes, maintaining customer privacy is crucial. Businesses should anonymize and aggregate data to ensure individual identities are protected. Prioritize data privacy and build trust by actively following data protection regulations and securing explicit consent from customers.
Recommended Articles
We hope that this EDUCBA information on “Ubuntu Office 365” was beneficial to you. You can view EDUCBA’s recommended articles for more information,

