What is the EXP Function in Excel?
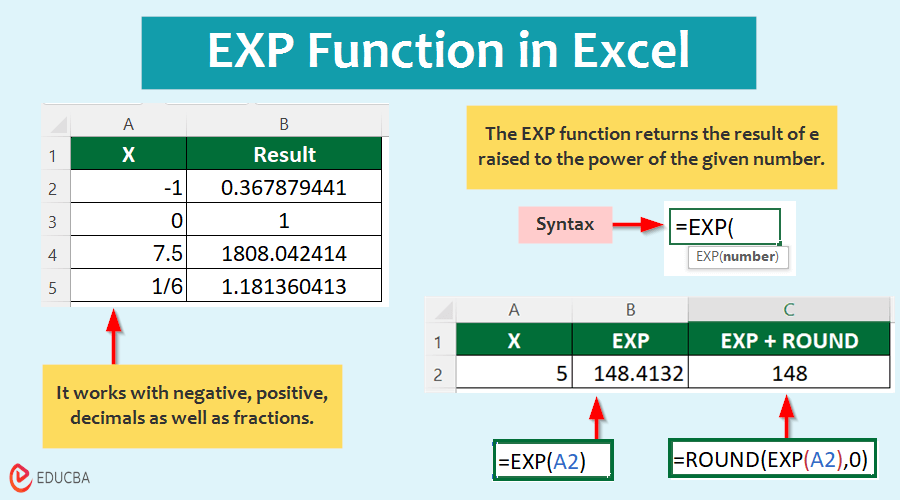
The EXP function in Excel calculates how Euler’s number (e) grows when raised to a specific power. Euler’s number (e) is approximately 2.71828. It is an important number in mathematics, especially in exponential growth and decay problems.
For example:
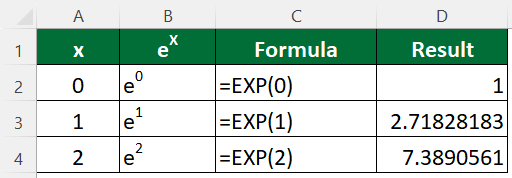
- =EXP(0) returns 1
- =EXP(1) returns e1, which is approximately 2.71828183
- =EXP(2) returns e2, roughly 7.3890561
You can also use cell references or more complex expressions as arguments. For instance, =EXP(A1) raises e to the power of the value in cell A1.
Note:
- EXP always uses Euler’s number e as the base.
- The number you provide as an argument is the exponent applied to e.
- The function returns the result of e raised to the power of the given number.
EXP Syntax
Syntax: =EXP(number)
Where,
Number: This is the exponent to which e is raised.
Application of EXP Function
You can incorporate the EXP function into larger formulas to perform more complex calculations involving e. Here are some practical applications:
1. Compound Interest
Suppose you invest $2,000 at an annual interest rate of 5% for 10 years. How do you use EXP function in Excel to find what the investment will be worth after 10 years?
Solution:
1. Understand the formula
You must know the compound interest formula: A=P*e(r*t)
Where:
- A is the amount of money accumulated after time t.
- P is the principal amount (initial investment).
- r is the annual interest rate.
- t is the time in years.
2. Add data in Excel
- In cell A2, enter the initial investment: 2000
- In cell B2, enter the annual interest rate: 5%
- In cell C2, enter the number of years: 10
3. Enter the formula
In cell D2, use the formula: =A2*EXP(B2*C2)
Result:
The result is approximately $3,297.4425.
How it works:
- The formula EXP(B2*C2) calculates e05 x 10 which is the growth factor for the investment over 10 years.
- Multiplication of growth factor and the principal amount ($2,000) helps find the total amount of money accumulated.
2. Exponential Growth
You have an initial investment of $2,000 and expect it to grow at an annual rate of 7% for 5 years. How do you calculate the future value of the investment using Excel’s EXP function?
Solution:
1. Know the formula
The formula to calculate the future value with exponential growth is: Future Value=Initial Value⋅e(r⋅t)
Where:
- Initial Value= starting amount
- r= growth rate
- t= time in years
2. Enter available data in Excel
- In cell A2, enter the initial investment amount: 2000
- In cell B2, enter the annual growth rate: 7%
- In cell C2, enter the number of years: 5
3. Enter the formula
In cell D2, enter the formula: =A2 * EXP(B2 * C2)
Result:
The result is approximately $2,838.1351.
How it works:
- The formula EXP(B2 * C2) calculates e07×5, which represents the growth factor for the investment over 5 years.
- The multiplication of this growth factor and the initial investment amount ($2000) helps find the future value.
3. Natural Logarithm
We want to calculate the natural logarithm of LN(e3) using Excel’s EXP function.
Solution:
The natural logarithm, denoted as LN(x), is the logarithm to the base e. It tells you the power to which e must be raised to obtain the number x.
1. We can use the formula: LN(ex)
Where:
- LN= natural logarithm function in Excel
- e= base of the natural logarithm
- x= the exponent (in this case, 3)
2. In the desired cell, enter the formula: =LN(EXP(3))
The result is 3.
How it works:
- The EXP(3) part of the formula calculates e3.
- Then LN calculates the natural logarithm of that result. Since LN(ex)=x, it simplifies back to 3.
Graphical Representation of EXP Function
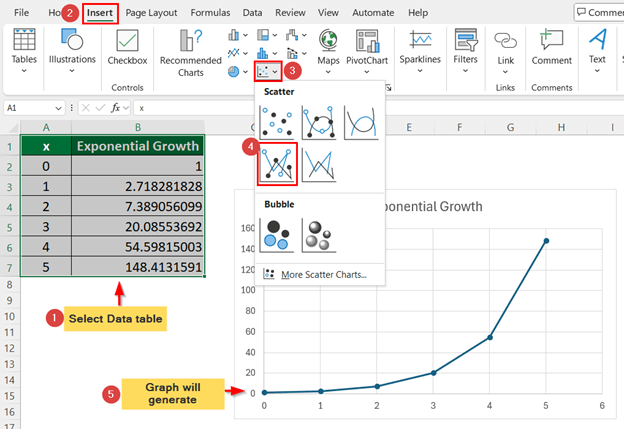
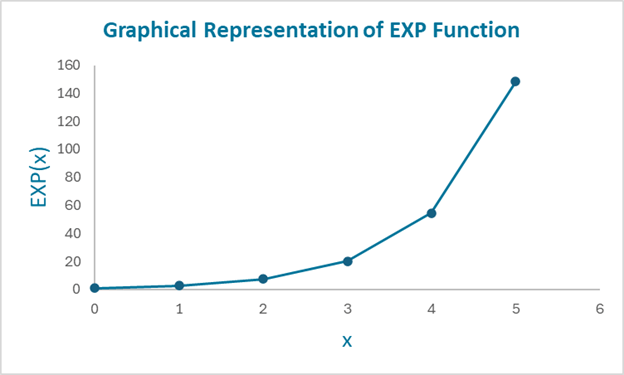
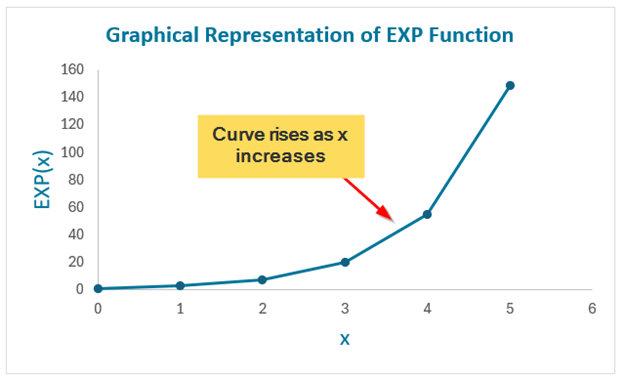
Let’s create a graph in Excel to visually represent how the output of the EXP function increases exponentially with the input values of x.
Solution:
Step 1: Enter your data
- Column A: Enter your input values for x (e.g., 0, 1, 2, etc.).
- Column B: Use the EXP function to calculate the exponential value for each x value. Type formula =EXP(A2) in cell B2, then drag it down.
Step 2: Create the graph
- Select Your Data: Select the cells with x values and corresponding EXP results.
- Insert the Graph: Choose Scatter chart (from the Insert tab), and select Scatter with Smooth Lines.
Step 3: Add titles
- Axis Titles: Label your x-axis as “x” and your y-axis as “EXP(x)”.
- Chart Title: Give your chart a title like “Exponential Growth of EXP Function”.
Step 4: Interpret the graph
- The graph will show a curve that rises steeply as x increases.
- This shows that even small increases in x cause the output of the EXP function to grow significantly, illustrating the concept of exponential growth.
How EXP Function Ensures Precision in Calculations?
Excel calculates numbers using a system called floating-point arithmetic. This method can only be precise up to 15 digits. For example, Excel shows e as 2.718281828459045, which is accurate to 15 digits.
However, some complex calculations or scientific computations require even more accuracy. In such cases, slight rounding errors might occur. This can be important in fields like finance or science, where exact numbers are critical.
Tips:
To maximize the precision of your Excel calculations, follow these advice from Kamonwan Achjanis, the author of the Excel course at BestKru:
- Use the EXP(1) function instead of manually entering e’s value
- Avoid unnecessary intermediate calculations
- Consider using the ROUND function judiciously
Limitations of EXP Function
While the EXP() function is useful, it has some limitations:
- Range Limits: EXP() can only handle values up to 2.3 × 10308. If you go beyond this, you will get a #NUM! Error.
- Performance Issues: Complex exponential calculations can slow down your spreadsheet.
- Overflow Errors: Be careful with large numbers, as they can exceed Excel’s limits and cause errors.
Tips:
- Break down complex calculations into smaller steps.
- Use logarithms for very large exponents.
- For extreme precision, consider using specialized scientific software.
Final Thoughts
The EXP function in Excel might seem complex at first glance, but it is a powerful tool for anyone dealing with exponential calculations. Whether working on financial models, growth projections, or statistical analysis, understanding and using the EXP function can simplify your calculations and improve your data analysis.
Frequently Asked Questions (FAQs)
Q1. Can the EXP function handle negative numbers?
Answer: Yes, the EXP function can handle negative numbers. For example, EXP(-1) returns approximately 0.367879, the reciprocal of e.
Q2. Are there any specific software or tools where the EXP function is particularly useful?
Answer: Yes, the EXP function is useful in various tools and fields:
- Financial modeling (e.g., compound interest calculations)
- Statistical analysis (e.g., in the calculation of certain probability distributions)
- Engineering and scientific calculations
Q3. How does the EXP function interact with other Excel functions?
Answer: You can combine the EXP function with other functions in Excel for more complex calculations. For example:
- With SUM: =SUM(EXP(A1), EXP(B1)) adds the exponential values of numbers in cells A1 and B1.
- With IF: =IF(EXP(A1) > 1000, “Large”, “Small”) checks if the exponential value of the number in A1 is greater than 1000.
Recommended Articles
We hope this guide to the EXP function in Excel enhances your understanding of exponential calculations. Check out these recommended articles to learn more about advanced Excel techniques.
