What is Economic Profit?
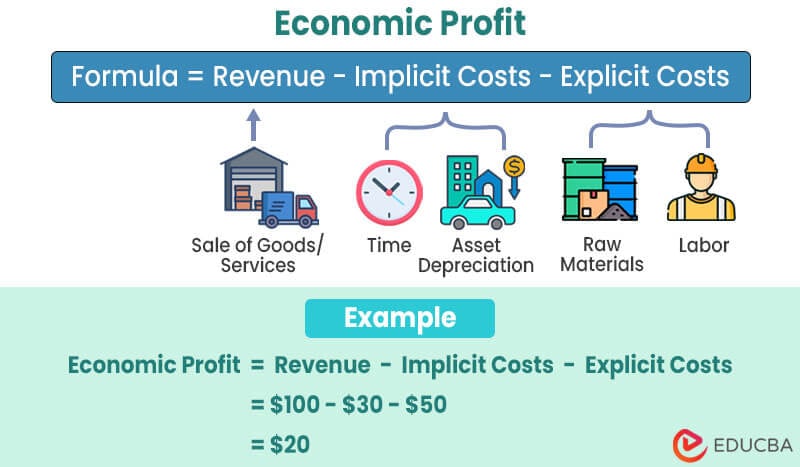
Economic profit is the surplus amount a business has left after deducting their explicit costs (labor, rent, etc.) and implicit costs (Lost time & opportunities, etc. ) from the revenue.
It tells us about the business’s profitability, financial health, and sustainability. A positive profit means a company makes more money than it spends, while a negative profit means it is not making enough money to cover its costs.
Table of Contents
Formula
- Revenue: Income from selling products or services.
- Implicit Costs: Intangible expenses (e.g., owner’s time, missed income from other sources).
- Explicit Costs: Tangible expenses (e.g., materials, labor, depreciation, marketing).
Step #3: Consider hidden costs like time and missed income from other sources.
Example: Calculating the resources used and time spent, we have implicit costs of $2,000.
Step #4: Subtract total costs (explicit and implicit) from total revenue to find the profit.
Example: Profit = $10,000 (revenue) – ($5,000 + $2,000) (costs) = $3,000.
Step #5: Interpret the Result
- If the profit value is positive, the company is in surplus and can cover all its expenses.
- If the result is negative, the company can’t cover its expenses, and the owners can consider other investments.
Example: Positive profit value ($3,000) tells us our business is in good shape financially.
Examples
Example #1
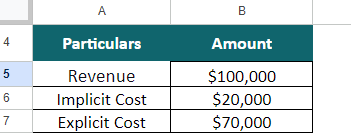
A business firm, Xane Ltd, has revenues of $100,000 and explicit costs of $70,000. The implicit cost of the business is $20,000. Calculate the economical profit of the firm.
Given:
Solution:
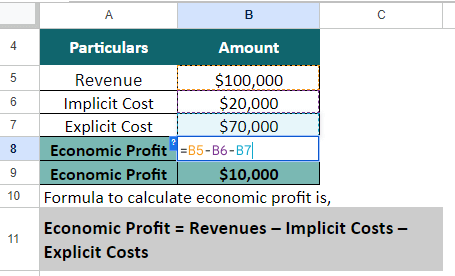
As per the formula,
Economic profit = Revenues – Implicit Costs – Explicit Costs
= $100,000 – $20,000 – $70,000 = $10,000
Thus, the total profit of the firm is $10,000.
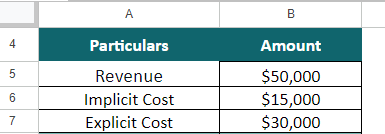
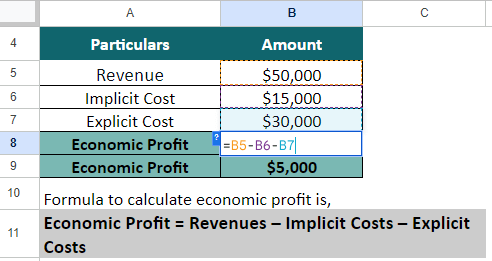
As per the formula,
Economic profit = Revenues – Implicit costs – Explicit Costs
= $50,000 – $15,000 – $30,000 = $5,000
Thus, the total profit of the farm is $5000 per year.
Economic Profit Graph
The economic profit graph helps businesses plan strategically to be able to find the perfect price for the product at which they can make the maximum profit.
1. Important Curves in the Graph
- The Marginal Revenue (MR) curve shows the additional revenue from selling one extra product unit.
- The Marginal Cost (MC) curve illustrates the cost of producing one additional product unit.
- The Average Total Cost (ATC) curve represents the average cost per production unit.
2. How to find the Economic Profit Area on the Graph?
- To determine profitability, we find the point where Marginal Cost (MC) and Marginal Revenue (MR) intersect.
- Then locate the Average Total Cost (ATC) for that quantity of products.
- The region between MR and ATC on the graph indicates whether the firm is making a profit.
3. Interpretation
We have three graph scenarios that show different profit levels.
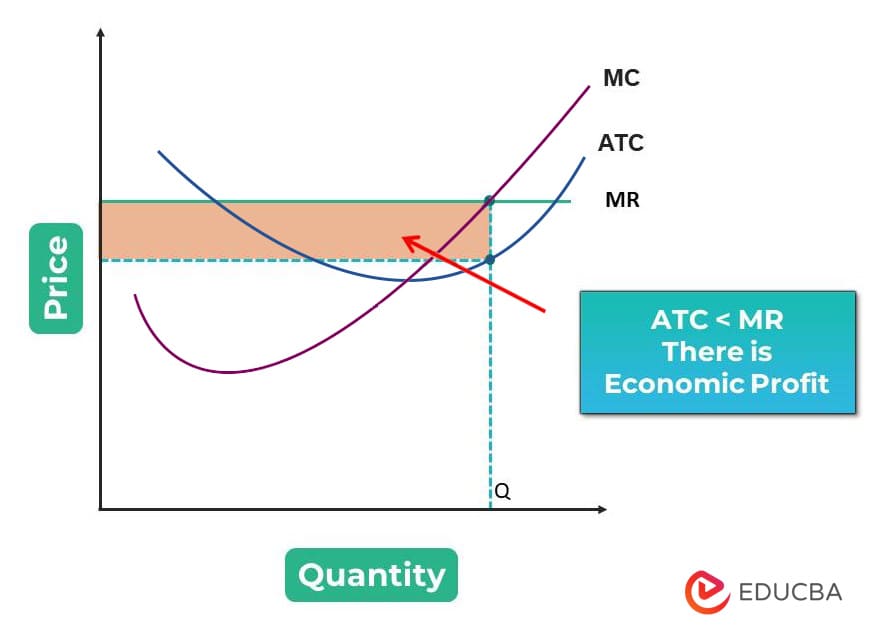
a) Economic Profit (Occurs when: Average Total Cost < Marginal Revenue)
When a business’s average total cost is below the marginal revenue value, the difference between both is the company’s economic profit.
Example: A firm has marginal revenue (MR) of $40 and an average total cost (ATC) of $30 for the quantity of 100 units. So, the profit will be $1,000 (($40-$30) x 100).
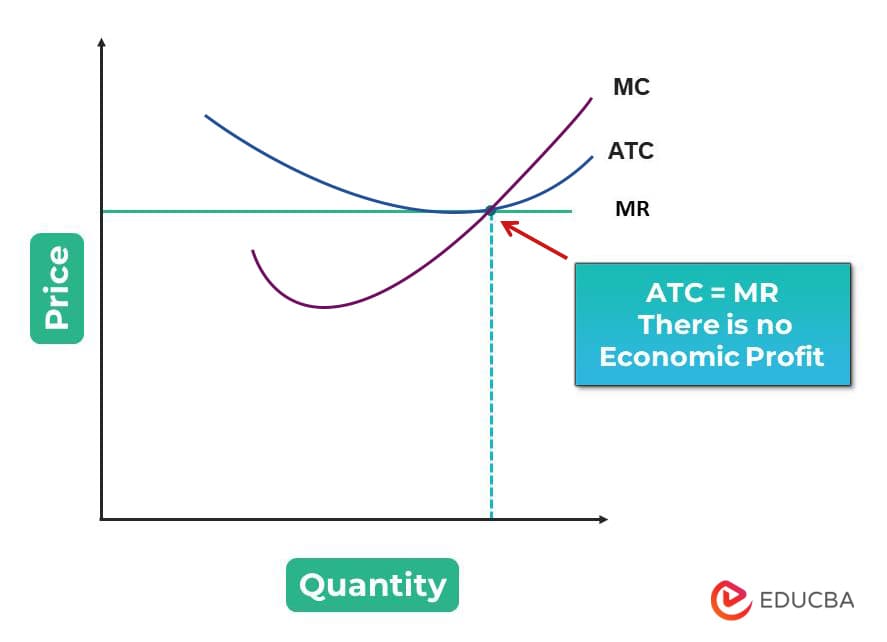
b) No Economic Profit (Occurs when: Average Total Cost = Marginal Revenue)
When the company’s average total cost is the same as its marginal revenue value, its economic profit is zero.
Example: A firm produces 150 product units with an average cost of $25 per unit. The marginal revenue is also $25 per unit at this production level. Thus, it doesn’t make any economic profit but can cover its costs.
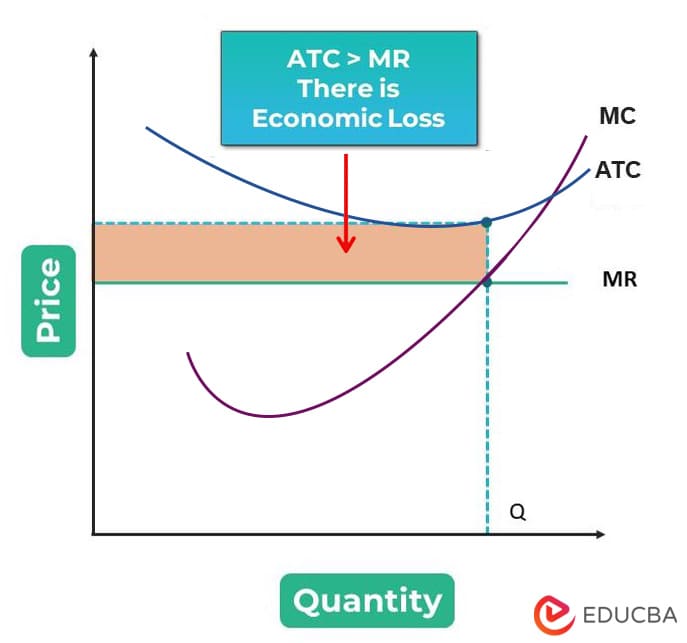
c) Economic Loss (Occurs when: Average Total Cost > Marginal Revenue)
The company suffers an economic loss when the marginal revenue is lower than the business’s average total cost.
Example: A firm produces 50 units where the marginal revenue ($15) is less than its average total cost ($20). This results in an economic loss of $250 (($15-$20)x50).
Answer: Zero economic profit, also called average profit, is when a business makes enough money to cover all of its direct and indirect costs but no more. In other words, the company is just making enough to compensate its owners for their time, effort, and capital. It indicates that the company requires minimum profit to keep a business going in the long run.
Q3. Why is there no economic profit in a perfect competition market?
Answer: In a perfect competition market, no firm has the power to influence the prices, and they all follow the same market price. Thus, they keep adjusting their production level and average total cost to stay in normal profit.
Some firms can make economic profit in the small run, but when new firms enter the market, supply increases, price decreases, and economic profit reduces until it reaches zero. Thus, in the long run, the market settles where firms earn only normal profit.
Recommended Article
We hope this EDUCBA information on the Economic Profit benefited you. For further guidance on business-related topics, EDUCBA recommends these articles:

