Updated July 11, 2023

Definition of Average Fixed Cost
Average fixed cost (also called “fixed, variable overhead”) is the per-unit cost of the company, which is calculated by dividing the permanent or fixed cost by the number of actual production units and which varies as the production in terms of the number of units increases or decreases in a particular year.
Explanation
- A.F costs mean the total fixed cost apportioned in terms of the number of units produced during the year.
- A.F. cost is the variable cost per unit since the per-unit cost will change depending on the number of units produced.
- Fixed costs are unavoidable in nature & remain the same irrespective of the company’s production cycle.
- In exceptional cases, even the total fixed cost may increase due to an increase in fixed expenses such as hiring more employees, rent payments, interest payments, etc.
- It is opposite to average variable cost, which is constant per unit & the total variable cost increases as the number of units produced increases.
The Formula for A.F Cost
The formula for fixed cost goes like this:
- The fixed cost component may include fixed employee pay, factory premises rent, warehouse premises, license cost of any software, Annual maintenance charge of machinery, insurance cost, audit services cost, etc.
- The number of units produced varies depending on the operational efficiency of the plants
Examples of Average Fixed Cost
Following examples are given below:
Example #1
Let’s say a company produces plastic bottles every year. The normal capacity of the plant is 500,000 units annually. The normal operational efficiency ranges from 70% to 90%. The selling price of one unit is $ 15 & variable cost of production of one unit is $ 5. The company must pay fixed costs for employees of $ 5,00,000 annually. The company has taken the factory on rent for $ 50,000 per month & it has a warehouse which is also on a rental basis for $ 40,000 per month.
Further company has insured its factory premises for $ 30,000 as a one-time cost. The company also needs to incur an annual maintenance cost of $ 40,000 per annum for its plant & machinery. The depreciation & amortization cost is $ 500,000 for the year. The company is curious to know whether it can reduce its fixed cost per unit.
Solution:
Total fixed cost is calculated as
| Particulars | Amount ($) | |
| A | Fixed Pay of employees | 5,00,000 |
| B | Factory Rent ($ 50,000 * 12 months) | 6,00,000 |
| C | Warehouse Rent ($ 40,000 * 12 months) | 4,80,000 |
| D | Insurance of factory premises | 30,000 |
| E | Annual Maintenance Cost of machinery | 40,000 |
| F | Total Cash Fixed Cost | 16,50,000 |
| G | Depreciation & Amortisation | 5,00,000 |
| H | Total Fixed cost (F+G) | 21,50,000 |
A.F cost is calculated as
| Particulars | Efficiency Level | |||
| 70% (Amount in $) | 80% (Amount in $) | 90% (Amount in $) | ||
| A | Normal Capacity (units) | 5,00,000 | 5,00,000 | 5,00,000 |
| B | Selling Price per unit | $ 15 | $ 15 | $ 15 |
| C | Variable cost per unit | $ 5 | $ 5 | $ 5 |
| D | Contribution per unit (B-C) | $ 10 | $ 10 | $ 10 |
| E | Production Efficiency | 70% | 80% | 90% |
| F | Actual units produced (A*E) | 3,50,000 | 4,00,000 | 4,50,000 |
| G | Total Fixed cost | $ 21,50,000 | $ 21,50,000 | $ 21,50,000 |
| H | Breakeven number of units (G/D) | 2,15,000 | 2,15,000 | 2,15,000 |
| I | A.F Cost (G/F) | $ 6.14 | $ 5.38 | $ 4.78 |
Explanation
- The A.F. cost is reduced with an increase in the company’s production efficiency.
- Some companies may also take a stand that depreciation & amortization is a non-cash expenditure & hence has to be excluded from total fixed & only cash fixed costs may be considered.
- In that scenarios, the A.F cost would be as follow:
| Particulars | Efficiency Level | |||
| 70% (Amount in $) | 80% (Amount in $) | 90% (Amount in $) | ||
| A | Cash Fixed cost | 16,50,000 | 16,50,000 | 16,50,000 |
| B | Number of units produced | 3,50,000 | 4,00,000 | 4,50,000 |
| C | A.F Cost | $ 4.71 | $ 4.13 | $ 3.67 |
Example #2
The company has no track of its cost per unit figures. As per expert advice, the total cost per unit is $ 650. As per calculations, the company has confirmed that the variable cost per unit is $ 400. The company has produced 45,000 units during the year. The company wishes to know the fixed cost incurred during the year.
Solution:
| Particulars | Amount ($) | |
| A | Total cost per unit | 650 |
| B | Variable cost per unit | 400 |
| C | A.F cost per unit (A-B) | 250 |
| D | Number of units produced | 45,000 |
| E | Total Fixed cost for the year | 1,12,50,000 |
Explanation
- The company can now reconcile the fixed cost with the actual fixed costs incurred during the year.
- This will help the company cross-check whether the expert’s total cost per unit is appropriate or vague.
Average Fixed Cost Graph
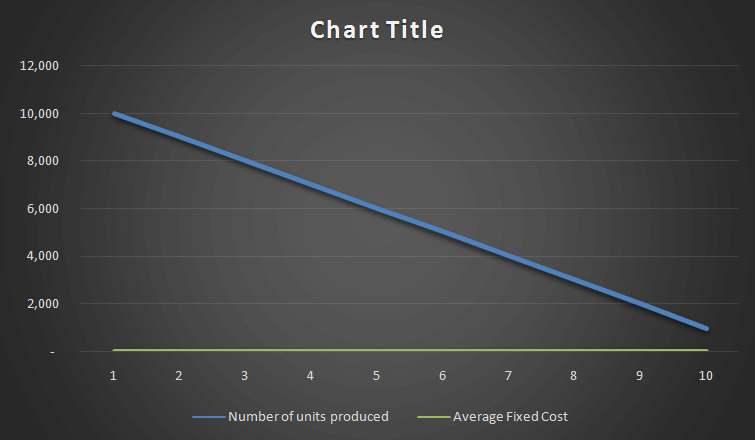
We can have the following data for the graph:
| Number of units produced | Fixed Cost | A.F Cost |
| 10,000 | 50,000 | 5 |
| 9,000 | 50,000 | 6 |
| 8,000 | 50,000 | 6 |
| 7,000 | 50,000 | 7 |
| 6,000 | 50,000 | 8 |
| 5,000 | 50,000 | 10 |
| 4,000 | 50,000 | 13 |
| 3,000 | 50,000 | 17 |
| 2,000 | 50,000 | 25 |
| 1,000 | 50,000 | 50 |
The graph is as follows:
- As you can see, the A.F. cost is downward sloping.
- This is due to the effect of an increase in the base, i.e., an increase in the number of units produced.
- The graph can also move in any direction if the company has uncertain production patterns.
Advantages
Some of the advantages are given below:
- It is easy to calculate the A.F. cost if we are provided with the relevant figures.
- The cost reduces per unit as the company produces more & more units.
- Thus, an increase in operational efficiency leads to a reduction in A.F. costs per unit.
- A reduction in A.F. cost implies an increase in the unit’s profitability.
- Companies can also calculate the breakeven number of units to be achieved. Using the breakeven figures, the company can decide the targeted minimum number of units to be produced.
- Management can decide whether to invest in new plant machinery or not.
Disadvantages
Some of the disadvantages are given below:
- A reduction in operating efficiency leads to an increase in A.F. cost per unit.
- Also, if a company increases the fixed cost while keeping the base same (i.e., no increase in unit production), it increases A.F. cost.
- Analysts often ignore A.F. cost when the break-even number of units once recovers the total fixed cost.
- It is an unavoidable committed cost of the company.
- An increase in A.F. cost implies lower efficiency & may trigger going concerns issues for the company.
- An increase in A.F. cost also gives improper cost results to the management since the total cost per unit exceeds the sales price.
Conclusion
We can say that “the more the company produces, the lower will be its A.F costs”. This is also visible from the AFC graph, as shown above. Thus, the graph has to be downward sloping. In concluding, we can say that the A.F. cost per unit will increase if the company incurs more fixed expenses or the production units have reduced drastically. An increase in A.F. cost implies questionable efficiency of the company. Management may take strict actions if the A.F. cost exceeds a certain limit. Thus, for the A.F. cost, we say “the lower the better”.
Recommended Articles
This is a guide to Average Fixed Costs. Here we also discuss the definition and examples of Average Fixed Cost and its advantages and disadvantages. You may also have a look at the following articles to learn more –


