Updated March 16, 2023
Introduction to Azure Functions Logging
Azure functions logging is defined as enabling the write traces for our application code; we need to assign the log level to the traces of the application. Log levels provide a way for us to limit the amount of data that was collected from our traces. We assign the log level to every log, and the value of the log level is an integer which indicates the importance of logging.
Key Takeaways
- Azure function offers built-in integrations with the insights of azure applications for monitoring the executions of functions.
- There are two types of log streams in azure i.e. built-in log streams and live metrics streams. We can access the real-time log by using a live stream.
Overview of Azure Functions Logging
Azure provides monitoring capabilities that are available for function monitoring. Application Insights collects data on performance, logs, and errors. We can easily diagnose issues and gain a better understanding of how our functions are used by detecting anomalies in performance and analytics tools.
The azure functions logging tools are designed to help us in improving the usability and performance of our functions. We are using application insights at the time of project development. At the time of developing applications, we need to see what is written in our logs. Basically, there are two ways to view the stream logs files generated by our function executions: live metrics stream and built-in log streaming.
Monitor Executions
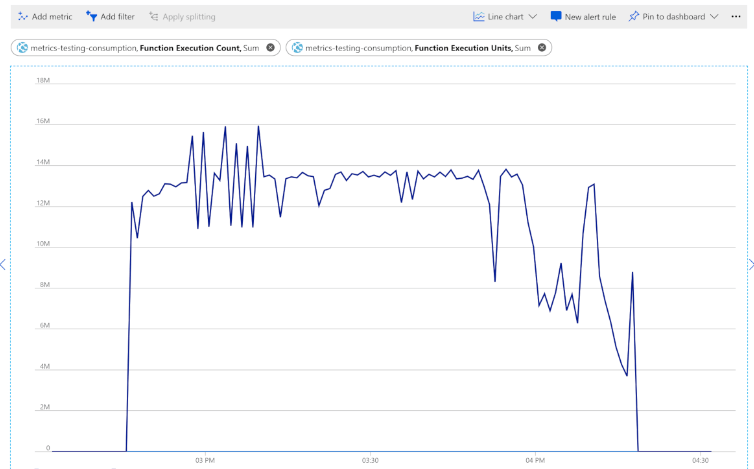
We can analyze the azure functions metrics from azure services by using explorer of metrics. Following steps shows how we can see the monitor metrics execution by running the function application as follows:
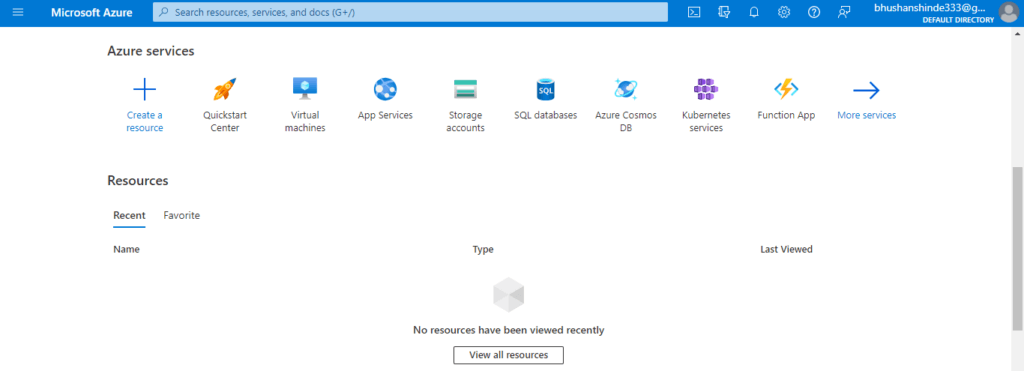
1. In the first step, we are login into the azure portal by using credentials. In the below example, we are login into the Azure portal.
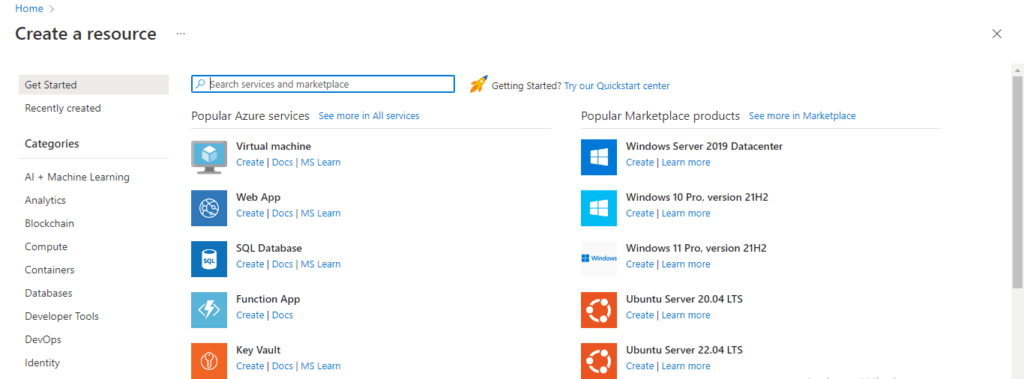
2. After opening the azure portal now in this step, we are opening all the resources by clicking on create resource tab.
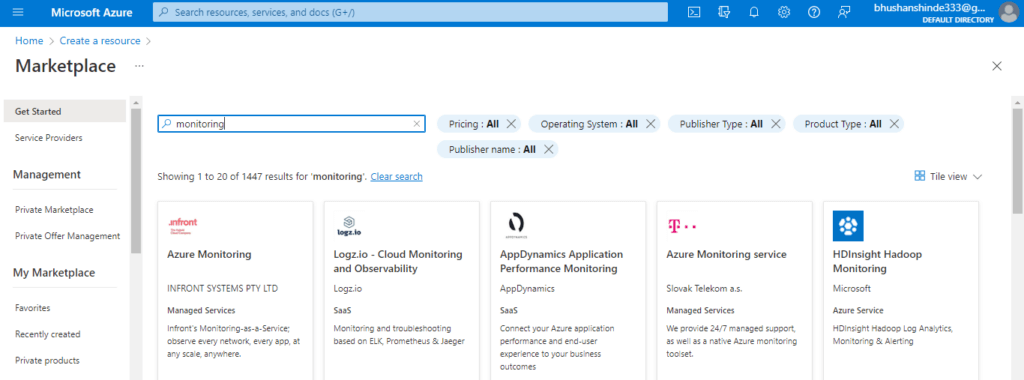
3. After opening the resources now in this step, we are searching the monitoring in the search tab.
4. Then, we are selecting the metric from the function execution count; it will add the sum of the execution count from the chosen period as follows.
5. After choosing the function execution count now in this step, we are adding the execution metrics for the function units as follows.
Azure Functions Logging Alternatives
There are two ways to view the stream log in a file which is generated by using function execution as follows:
1. Built-in Streaming Log
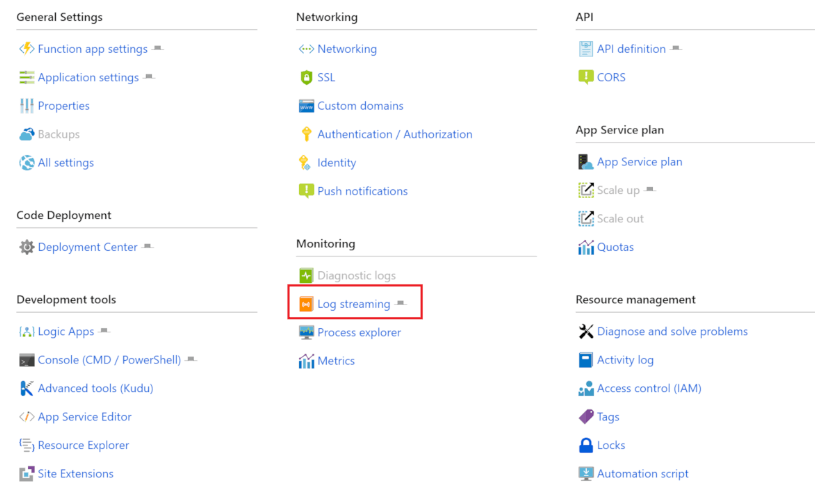
The app service platform will allow us to view the stream of application log files. It is the same as the output when we are debugging the function while developing the test tab on the portal. All log-based information is displayed in the stream logs. The streaming method supports a single instance that is used when an app runs on Linux in a consumption plan. The below example shows built-in log streaming as follows.
2. Live Metrics Stream
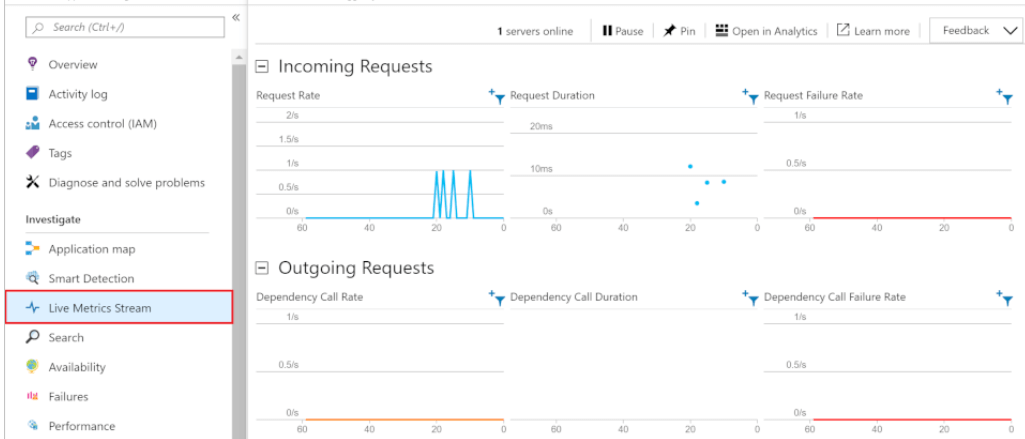
At the time our function app is connected to the application insights, we can view the data log and other metrics in real time by using the stream of live metrics. This method is used when the monitoring function is running on multiple instances on the linux consumption plan. This method makes use of sampled data. We are viewing log streams both through the portal and in the development environments.
Applications of Azure Functions Logging
We’re integrating Azure Functions with Application Insights to enable the monitoring of our function applications. Application Insights is an Azure Monitor feature that extends into the service of application performance management and collects application functions. When we build an app function, we can integrate application insights.
We’re using application insights without any custom settings. If we use Visual Studio, the default configuration produces large amounts of data, and we must reach the data cap in our application insights. When we create the function app, we enable the application insights. We are configuring the log level to the application as follows.
- Trace – The code of trace is 0. This log level will contain detailed information. It might contain sensitive data.
- Debug – The code of debug is 1. This log level is used in the interactive investigation at the time of development.
- Information – The code of information is 2. This log level tracks the application’s general flow.
- Warning – The code of warning is 3. This log level is used to highlight the abnormal event of the application.
- Error – The code of error is 4. This log level is highlighted when the execution flow of the application is stopped.
- Critical – The code of critical is 5. This log level defines the system crash or failure in the application.
- None – The code of none is 6. This log level is used to disable the logging for the specified category.
The below example shows how we can define the log level in the azure function application as follows.
{
"logging": {
"fileLoggingMode": "always",
"logLevel": {
"default": "Information",
"Host.Results": "Error",
"Function": "Error",
"Host.Aggregator": "Trace"
}
}
}
History
The first mechanism of logging is available in the TraceWriter class. We can accept the instance of the TraceWriter parameter in the function method.
The below example shows how we can define the history of logging functions as follows:
public static void Run(Message msg, TraceWriter log)
{
log.Info("Fun invoked");
}
The TraceWriter makes logs available through the log of invocation into the command line while debugging the func.exe. We can also view this raw data which was stored in the table storage and storage account as follows.
Log4net – Azure functions do not load the configurations from app.config or web.config. Loading the configuration is not automatic, so we need to avoid the disk I/O on the invocation. So we are using basic configuration for adding the desired appender as follows.
{
var stackifyAppender = new StackifyAppender();
stackifyAppender.ActivateOptions ();
log4net.Config.BasicConfigurator.Configure (stackifyAppender);
}
Serilog – We can inject the instance of log into the scope that we can demonstrate with the log4net. The below example shows Serilog as follows.
Code:
var log = new LoggerConfiguration()
.WriteTo.TraceWriter(traceWriter)
.CreateLogger();
log.Warning("Serillog");
Conclusion
The azure functions logging tool is designed to help us to improve the usability and performance of our functions. At the time of developing applications, we need to see what is written in our logs. Azure functions logging is defined as enabling the write traces for our application code; we need to assign the log level to the traces of the application.
Recommended Articles
This is a guide to Azure Functions Logging. Here we discuss the introduction, monitor executions, alternatives, applications, and history. You can also look at the following articles to learn more –

