Updated March 13, 2023
What is Azure Log Analytics?
- In Azure portal, Azure Log Analytics is available as a tool for editing and running command queries from data composed by Azure Monitor Logs and further evaluates their outcomes interactively via a controlling analysis engine. Then, one can apply those queries for maintaining other Azure Monitor features including workbooks and log query alerts. We can obtain the Log analytics service on the Azure Monitor menu from the Logs option or even from the utmost additional services available in the Azure portal.
- The Azure’s service Log Analytics is implemented to observe the cloud and on-premises settings for supporting their accessibility, performance, and a few other features. As a section of the service, prevailing interactive query proficiencies are present which permit the user to request progressive questions definite to the data records. Whereas an inclusive IDE is presented for executing these queries, then it is occasionally essential to obtain the records programmatically.
How to Create Azure Log Analytics?
For creating the Azure Log Analytics we need to follow the below steps:
1. Run Log Analytics:
In the Azure dashboard, from the Azure Monitor menu present in the subscription open the Log Analytics demo environment option or, choose Logs. This will configure the primary scope to a workspace of Log Analytics, therefore the written query can choose from entire data records in that workspace. You can see in the upper left corner of the screen, the scope option. But in a demo environment, the scope option is not available; you can only view the scope option running one’s own environment.
2. Observation of Table Data Info:
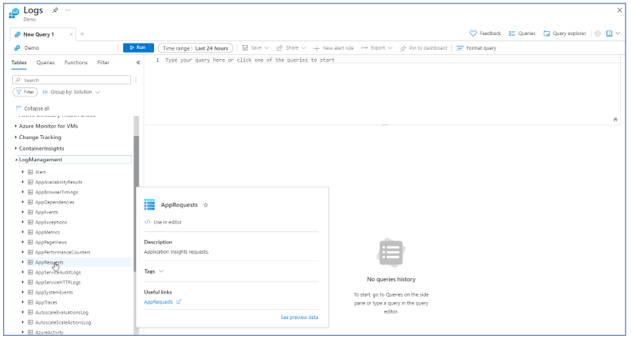
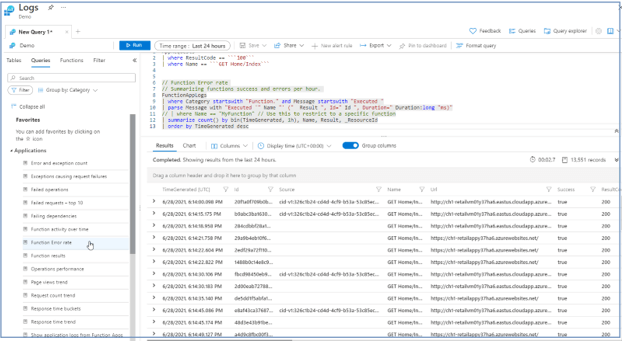
On the left side of the screen, you can view the Tables tab option where one can examine the tables which are present in the existing scope. By default, these tables are assembled by Solution however one can filter them or alter their grouping. Expanding the solution Log Management, position the AppRequests table. To observe the table’s scheme you need to expand it or, can hover over its name which displays additional facts about it.
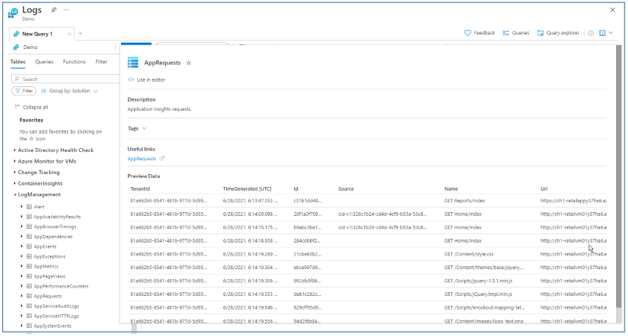
For visiting the table reference which documents every table plus its column, choose the link option below Useful Links. You can have a swift look over the latest records present in the table with the Preview data option to ensure for writing a query to a data.
3. Writing a query:
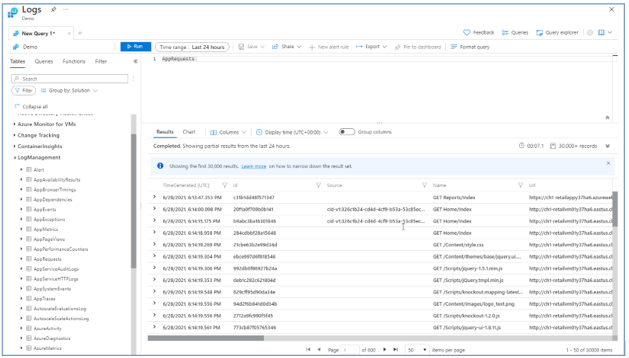
Using the AppRequests table, start writing a simple query. For adding it to the query window, just double-click its name or type in the window directly. Also, one can acquire IntelliSense which assists to accomplish the table names in the existing scope with KQL commands. After writing an easy query to retrieve complete records of a table, just execute it by choosing the Run option or even by entering shift + enter having the cursor placed wherever within the query text. The results can be viewed in the lower right corner of the screen.
4. Filtering the query results:
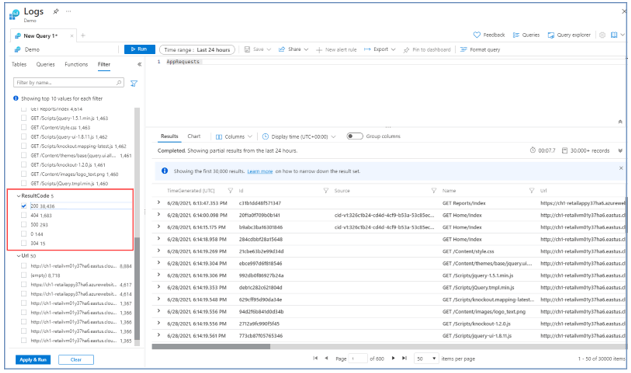
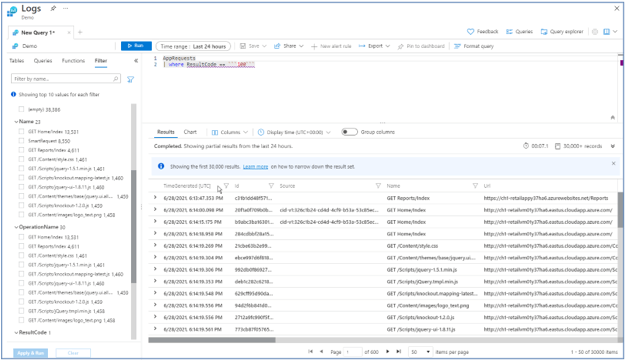
For decreasing the number of data records as output, we can add a query filter to it. For this, choose the Filter tab available on the left pane which displays columns that can be applied to filter results in the query results.
For numbering the records, choose 100 below ResultCode, and then the option Apply & Run is chosen. You can add a WHERE statement to the query to make a condition and return lesser records in the results.
5. Time Range:
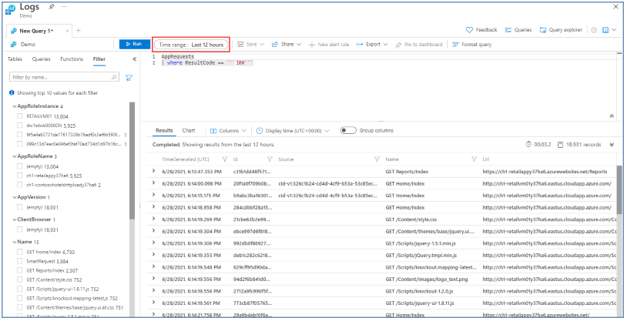
In a Log Analytics workspace, all tables include a column named as TimeGenerated that defines the time when the record was built. All queries contain a time range which limits the record results having a TimeGenerated value inside that specific range. Time range can be configured in the query or, can be done by means of the selector option present at the top of the screen. The default time limit is 24 hours, to show the query records from having 30000 records maximum which can be altered from the Time range dropdown list and changing the value and running again by Run option.
6. Conditions of multiple query:
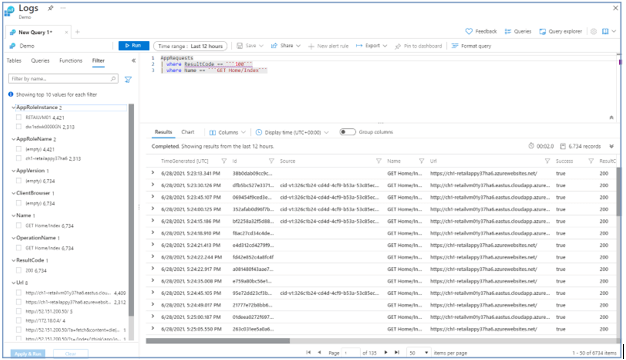
We can decrease the results by using other filter conditions since in a query we can comprise any number of filters so that it can aim the intended record results accurately. Under Name, choose the Get Home/Index and then choose Apply & Run option.
7. Analyzing Results:
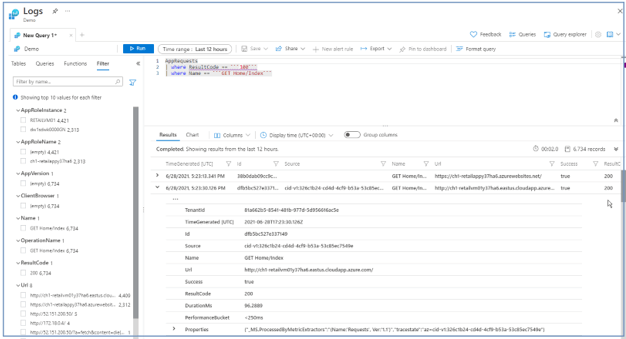
Log Analytics delivers features to operate with the type of results additionally, to aid writing and running queries. Begin by expanding a data record for observing the values existing for all of its columns.
8. Operating with charts:
In place of creating a query, one can choose an example query that implements numerical data records that can be viewed in a chart. On the left pane, choose Queries that contain example queries which one can add to the window of the query using the Log Analytics workspace.
Azure Log Analytics Tool
- Azure Log Analytics Tool is a service accessible by Azure portal and using this tool for writing log queries through an ironic language known as KQL (Kusto query language) we can edit and also run the queries.
- This lets the user program easy queries deprived of operating with the query language openly.
- Log Analytics is a major tool present in the Azure portal to modify the log queries and study their results interactively.
- Even if it is projected to apply a log query in a different place in Azure Monitor, then you will normally write and check it in Log Analytics but before doubling it to its final location.
Azure Log Analytics Scope
Azure Log Analytics permits consumers and admin to set up and implement various scopes to consume and query logs. In the Azure portal, when a log query is run in Log Analytics, then the set of data records examined by the query be determined by the scope and also the time range which is selected.
Query scope:
It states the records which are estimated by the query. Normally, this will contain complete records in an individual Application Insights application or, Log Analytics workspace. Azure Analytics lets you to configure a scope for a specific monitored Azure resource, which permits a resource owner for focusing just on their records, even when that resource existing writes to several workspaces. The scope is controlled by the procedure the user use to start Log Analytics whereas in a few cases scope can be changed also in the Log Analytics window.
Time Range:
It indicates the set of records that are calculated for the query that depends on the time when the data record was designed. This is stated by the TimeGenerated column present on each record in the application or workspace.
Conclusion
- Basically, Azure Monitor Logs is introduced as a feature of Azure Monitor which assembles and systematizes log plus performance data provided from examined resources and associated into an individual workspace.
- Here, Azure Log Analytics is implemented that is competent to promptly analyze billions of data records recognizing critical designs of data through a classy query language thus regaining a set of records and visualizing their generated results in a dashboard.
Recommended Articles
This is a guide to Azure Log Analytics. Here we discuss What is azure log analytics, How to create Azure Log Analytics, and tools. You may also have a look at the following articles to learn more –

