Updated April 3, 2023

Introduction to Behavioral Model in Software Engineering
In software engineering, behavioral model describe the overall behavior of the system. There are two types of behavioral models that are used to describe the system behavior, one is data processing model and another is state machine models. Data processing models are also known as DFD (Data Flow Diagram) which is used to show how data is processed as it moves through the system. State machine model is also known as State diagram which is used to show how the system will react with external events.
Data Flow Diagram
- Data flow diagram is used to model the system’s data processing.
- It is also cay as the Functional model as it is a graphical representation of an enterprise function within a defined scope. Data flow diagram shows end to end data processing.
- It can be easily converted into software as they just represent flow of the data objects. DFD diagram enable Software engineer to develop a model of the information domain and Functional domain at the same time.
- It provide a logical model of the system and show the flow of the data and the flow of logic involved.
Characteristics of Data Flow Diagram
- It shows the process, that transforms incoming data flows into outgoing data flows.
- Process that performs this transformation normally creates as well as uses data.
- External entities send and receive data flow from the systems.
- It is also called a bubble chart.
- Data flow diagram support a top-down approach for analysis.
Guidelines for Data Flow Diagram
- Level 0 DFD should depict software system as single bubble.
- Primary input and output are carefully noted.
- Refinement should begin by isolating candidate processes, data objects, data stores to be represented at the next level.
- All arrows and bubbles should be labeled with full names.
- Information flow continuity must be maintained from level to level. That means the data objects that flow into the system of any transformation at one level must be the same. Data objects that flow into transformation at the more refined level.
- One bubble at a time should be refined.
Data Flow Diagram Notation
Data flow diagram consists of a series of symbols joined together by a line. Data objects are represented by circles which are also called bubble charts. Data flow diagram are represented in hierarchical order. The first level data flow model is also called as DFD 0 level or context diagram which represents the system as a whole. Second level data flow model refines the context diagram and provides more details of first-level DFD. In a similar way, third level DFD refines the second level DFD, and so on. Data flow analysis models are developed by two organizations – Yourdon incorporation and Gane and Sarson.
Notations are as follows:
- Data Flow: It represents the movement of data flow from a specific origin to a destination.
- Process: It represents the users, procedures, or devices that use the data.
- Entity: It represents the source of data or destination data external sources or destination of data which may be users, programs, organizations or other entities that interact with the system but are outside its boundary.
- Data Store: There can be a single DFD diagram or can be exploded into various levels lime level 1, level 2, level 3, etc.
| Notation Name | Yourdon Incorporation | Gane and Sarson |
| Data Flow | ||
| Process |  |
 |
| Entity |  |
 |
| Data Store |  |
 |
State Diagram
State diagram is a dynamic model which represents the changes of state that an object goes through during the lifetime in response to events. It is used to help the developer better understand any complex functionality of specialized areas of the system.
Notations used in state diagram:
1. Initial State
It represents the start point of the diagram. It is also called as pseudo state where state has no variables and no activities.
2. Final State
It represents the end point of the diagram. It is also pseudo state as it doesn’t have any variable or activities. State diagram can have zero or more final states.
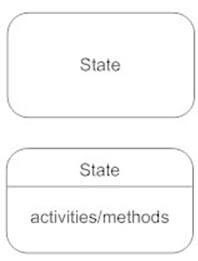
3. State
It represents the state of the object at an instant of time. State is a recognizable situation and exists over an interval of time.
4. Transition
It represents the changes from one state to other. It is denoted by an arrow. The event or action causing the transition is written beside the arrow, separated by slash. Triggerless transition occurs when the state completed an activity.
5. Event and Action
Trigger that causes a transition to occur and changes the state is called event or action.
6. History State
A flow may require that the object go into a wait state and on the occurrence of a certain event, go back to the state it was in, in this situation this notation is used.
7. Signal
When even causes the trigger to be sent to a state that causes the transition, then that message sent by the event is called a signal.
8. Self Transition
A state that has a transition that returns to itself is called self-transition.
Conclusion – Behavioral Model in Software Engineering
Here, in this article, we have seen the behavioral model and its two types in detail. We also saw the working of the data flow diagram and state diagram.
Recommended Articles
This is a guide to Behavioral Model in Software Engineering. Here we discuss the introduction, data flow diagram, guidelines, notation, and state diagram. You may also have a look at the following articles to learn more –


