Updated March 13, 2023

Introduction to Boxplot in R
Boxplot is one of the popular visualization or graph format which is useful for exploratory data analysis. And R is an open-source statistical language that is widely used in the Analytics industry, R language is a preferred language to generate Boxplot. It has a built-in library or packages support for the Boxplot graph, also there are additional packages available for R to enhance the Boxplot creation and better color representation of boxplots. Boxplot using R is always the primary choice of data analysts or data scientist professionals to understand data distribution.
Understanding the Boxplot using R
Before discussing syntax and the detailed process to create a boxplot, there are some basic concepts to start with the R language and boxplot which will help to understand the boxplot using R.
- R language as builtin Console or GUI to interact R commands or packages.
- R studio is the preferred IDE for the R
- R is a scripting language, which performs the processing and computation based upon the input data,
- To input data to the R environment or workspace, there are several options available, we e useful will discuss the CSV file input which is the most common option to import data to R.
- It stores data in variables or known as a data frame.
- Apart from importing or sourcing external data, there are several default datasets available in R, which is useful for the learning and practice of the R packages or machine learning practices.
Example: iris, Toothgrowth, Titanic, rivers. The full list of available datasets can be viewed using data() in R console or R studio. - R language data is represented as tabular structure in the dataframe.
Boxplots
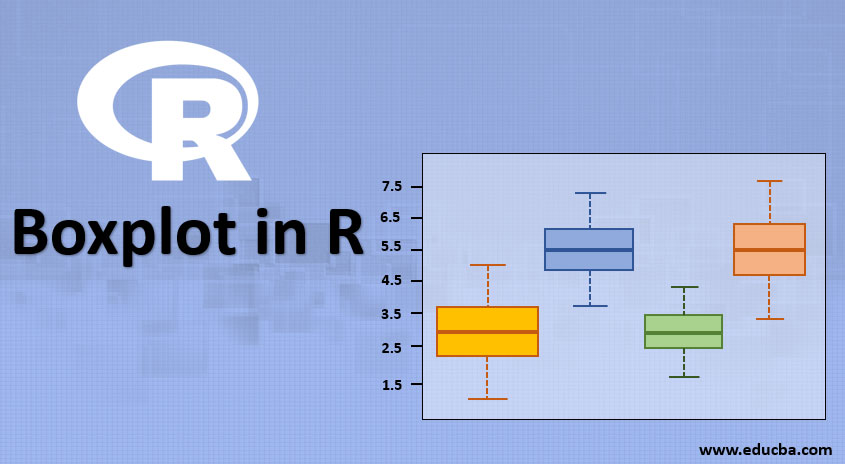
- These graphs are represented in the rectangular box, lines, and dots, and optionally colors and labels.
- Box Plots can be vertically or horizontally represented.
- It represents the data range in quartiles and the Interquartile range (IQR) which is Q1 to Q3 is represented in the box.
- Outliers in data represent as dots or small circles beyond the whiskers.
- whiskers are represented in dotted lines.
Syntax of Creating Boxplot Using the R Language
Syntax of creating boxplot using the R language is given below:
Syntax:
boxplot(x,...)

Package name: boxplot
This package is useful to create a boxplot and whisker plot of the given dataset or group of variable values. It accepts several arguments for the boxplot formation.S3 method is used to create a formula for the boxplot arguments, if the formula is not mentioned it will take the default.
Boxplot Syntax with s3 Method for the Formula in R
Syntax:
boxplot(formula, data = NULL, ..., subset, na.action = NULL)
Boxplot Syntax with Default s3 Method for the Formula in R
Syntax:
boxplot(x,...,data, range = 1.5, width = NULL, varwidth = FALSE,

notch = FALSE, outline = TRUE, names, plot = TRUE,

border = par("fg"), col = NULL, log = "",

pars = list(boxwex = 0.8, staplewex = 0.5, outwex = 0.5),

horizontal = FALSE, add = FALSE, at = NULL)
Description of Basic Arguments
- x: This argument denotes the data vector on which the boxplot will be created.
- This includes numeric vectors or a list containing the numeric vectors. This may include NA or null values.
- data: data frame or list in R
- formula: A formula, such as y ~ x, where y is a numeric vector of data values to be split into groups according to the grouping variable x
- … : For the formula method, named arguments to be passed to the default method these three dots are used as arguments.
- names: Group-level names which will be printed on the group boxplots
- notch: This is a boolean flag argument, which is useful to draw notch in each boxplot, and it represents if the median of two boxplots of groups differs or overlaps.
Also, there is a ggplot2 package that is popular and available for the R language for boxplot creation, with additional features of graph representation.
Syntax:
ggplot(data, formula) +geom_boxplot()
Here data represents the variables of data on which the boxplot will be created And the formula is the argument to assign conditions to the boxplot formation.
geom_boxplot() is for instructing R language for constructing boxplot through ggplot2 package
We will describe further how to create a boxplot using the boxplot package in this article.
How to Create Boxplot in R?
1. Set the working directory in R studio
o setwd(“path”)
2. Import the CSV data or attach the default dataset to the R working directory.
read.csv function in R is used to read files from local, from the network, or from URL
datafame_name = read.csv(“file”)
3. Attach function in R is useful for faster access of objects from the data frame.
attach(datafame_name)
4. Next to view the structure of the dataset use head() function.
By default head() will show the first part of the data frame or vectors or matrix.
head(datafame_name)
5. View the summary of the data set, some of the values will be graphically plotted in the boxplot
summary(datafame_name)
Summary() shows result values for
- min
- max
- median
- mean
- 1st quartile
- 3rd quartile
boxplot uses values shown through summary() for plotting graphs to represent data spread.
6. Draw the basic boxplot
- boxplot(datafamename$variablename~datafamename$variablenameOne)
- $ symbol is applied in R language to identify a particular variable or object from the data frame.
- ~ symbol is used to create multiple boxplots for the group belonging to the data frame.
7. Adding levels to the y-axis and providing the title to the boxplot for more meaningful representation
- boxplot(datafamename$variablename,ylab=’labelname’,main=’title’)
- lab argument is used to assign a y-axis label
- the main argument is used to assign the title of the graph
Examples of Boxplot in R
We will use the default iris dataset for the boxplot example.
As the best practice attach the dataset
- attach(iris)
- It will not show any output
To view, the structure of the iris data set use the head(iris) function
To view, the summary of the iris dataset use the summary(iris) function
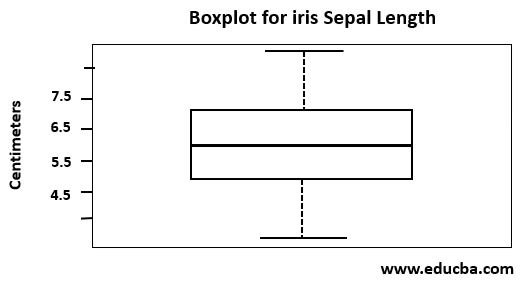
This boxplot is shown in the diagram in this example represents Spatial length variable data spread of iris dataset and y-axis level as centimeters and graph title as a boxplot for iris sepal length.
boxplot(iris$Sepal.Length,ylab=’centimeters’,main=’Boxplot for iris sepal length’)
Conclusion
Boxplots using R language helps to cleanse the row input data by identifying outliers for machine learning model development and implementations. These are useful to demonstrate the data spread and comparative analysis for data analysts. Statisticians and other data scientists prefer this graph for the research and analysis reference.
Recommended Articles
This is a guide to Boxplot in R. Here we discuss the Introduction and How to Create Boxplot in R? along with Syntax and Example. You can also go through our other suggested articles to learn more –


