Updated July 26, 2023
Definition of Break Even Analysis Example
Break Even Analysis is a tool that helps a company decide at which stage the products or services provided by the company will start making profits. To put it in simple language, it is a tool that will help a company decide how many products or services they should sell to cover the costs.
This is a stage where there is no profit or loss, and it only covers your cost. The costs covered in this calculation are mainly fixed. Lower fixed costs will lead to a lower break-Even value.
The formula to calculate Break-Even is:
Examples of Break Even Analysis (With Excel Template)
Let’s take an example to understand the calculation of the Break Even Analysis in a better manner.
Break-Even Analysis Example – #1
Let us look at a simple example that uses the above formula to calculate Break Even cost:
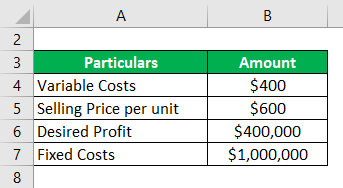
Solution:
A Contribution per Unit is calculated by using the formula given below
Contribution per Unit = Selling Price – Variable Costs
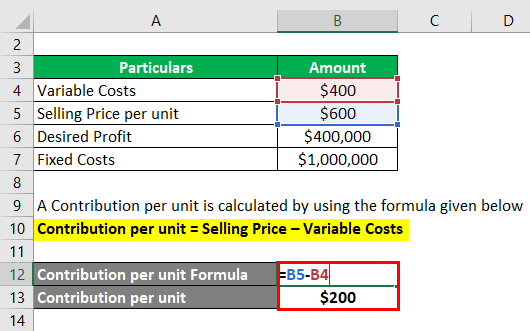
- Contribution per Unit = $600 – $400
- Contribution per Unit = $200
Break Even Point is calculated by using the formula given below
Break-Even = Fixed Costs / Contribution per Unit
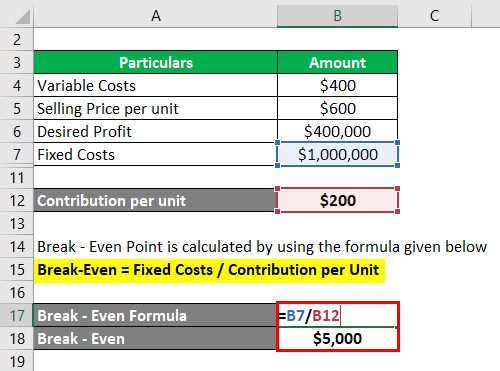
- Break-Even = $1000,000 / $200
- Break-Even = $5,000
Total Sales Required to Achieve Break Even Point is Calculated as
Total Sales = Break-Even Point * Selling Price per unit

- Total Sales = $5,000 * $6,000
- Total Sales = $3,000,000
We have subtracted the selling price and variable costs to calculate the contribution per unit. Now to calculate the break-even point i.e. how many units we will require to achieve the break-even, we will divide $10,000 by a contribution per unit of $200, which leads us to 5000 units. To calculate the total sales in $ terms, we will multiply the units required by the selling price per unit.
Break-Even Analysis Example – #2
Let us look at an example of break-even analysis by plotting total cost and revenue equations on the graph, known as a Break-even graph. We will plot the output on the horizontal axis, and costs and profit will be plotted on the vertical axis.
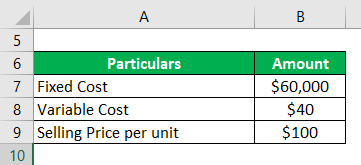
Franco cooperation makes iron benches and wants to determine the break-even point. The total fixed cost for his business is $60,000, and the variable cost is $40 per bench. He sells the bench for $100 per unit.
Solution:
A Contribution per Unit is calculated by using the formula given below
Contribution per Unit = Selling Price – Variable Costs
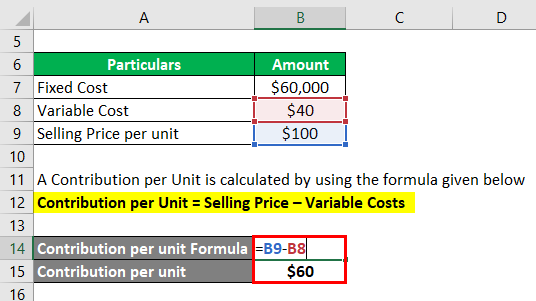
- Contribution per unit = $100 – $40
- Contribution per unit = $60
Now let’s calculate the number of benches Franco needs to achieve Break-Even
Break-Even Point is calculated by using the formula given below
Break-Even = Fixed Costs / Contribution per Unit

- Break-Even = $60,000 / $60
- Break-Even = 1000 benches
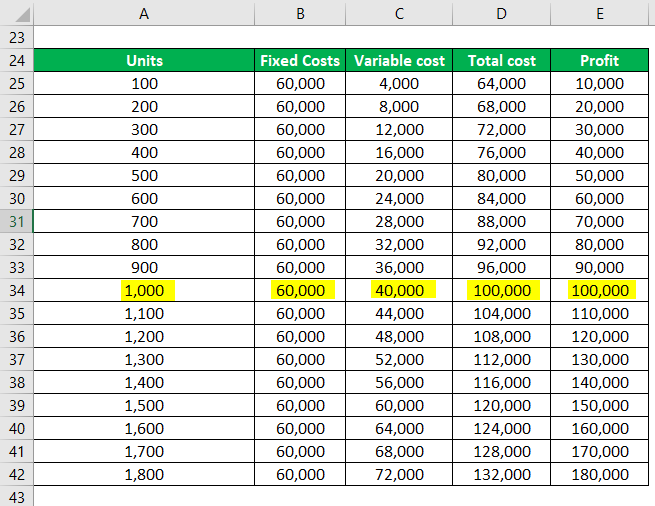
When Franco produces 1500 benches, the total cost is $120,000, and the total revenue is $150,000.
The break-even point is where total costs equal total revenue, and in this case, it is at $100 * $1000 = $100000
At a level below the Break-Even, losses are incurred. This is because total costs are greater than total revenue. If 500 units are produced, a loss of $30,000 is incurred
The below table shows the fixed costs, variable costs, total costs, and profit generated when a certain number of units are sold
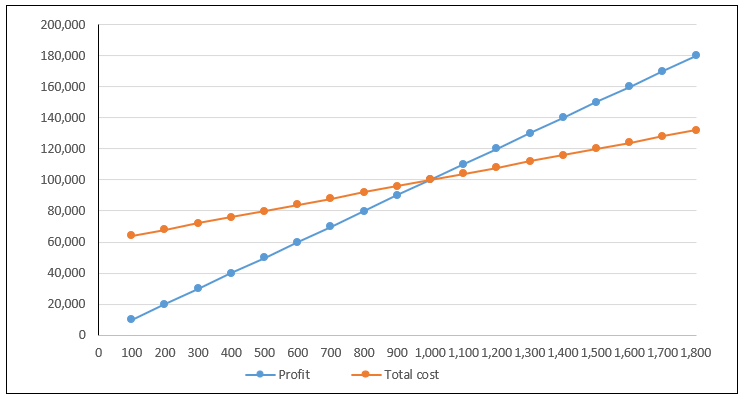
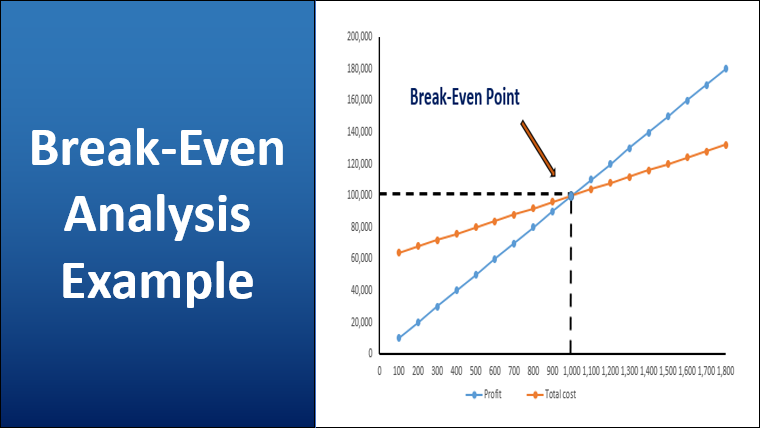
The above graph highlights the total cost and profit. The point where these lines intersect is known as the Break-Even Point. As we go below the graph, losses are made, and as we move to the upper side, the profits increase. Profits increase as output rises. At an output of 1500 profit of $30,000 is made. Also, the relationship between fixed and variable costs can be observed in the above table. The lower output will have a higher proportion of fixed costs
Break-Even Analysis Example – #3
Below is the income statement provided by a firm for a month.
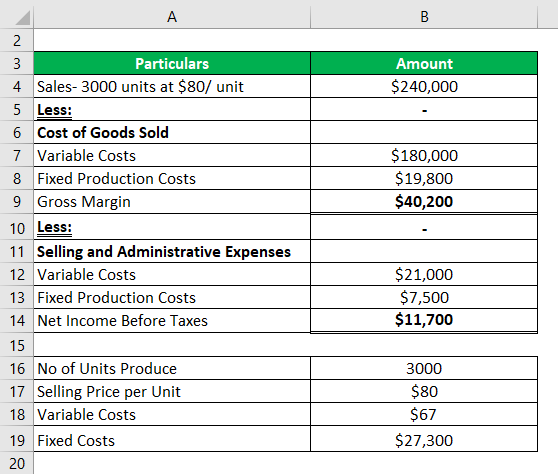
Let us now first calculate the break-even output
Break-Even Point is calculated by using the formula given below
Break-Even = Fixed Costs / Contribution per unit
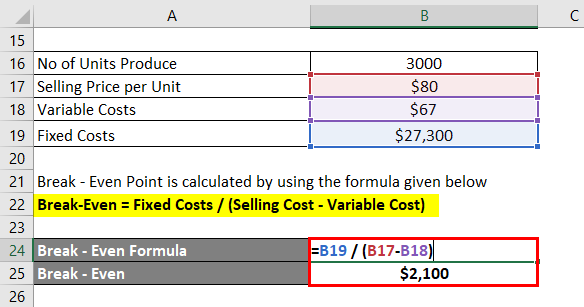
- Break-Even = Fixed Cost / (Selling Price – variable Costs)
- Break-Even= 27300 / (80 – 67)
- Break-Even = 2100
If the variable costs increase by $4, what will be the change in the break-even point?
An increase in variable costs of $4 makes the variable costs $71. The break-even point moves up to
Break-Even Point is calculated by using the formula given below
Break-Even = Fixed Costs / Contribution per Unit
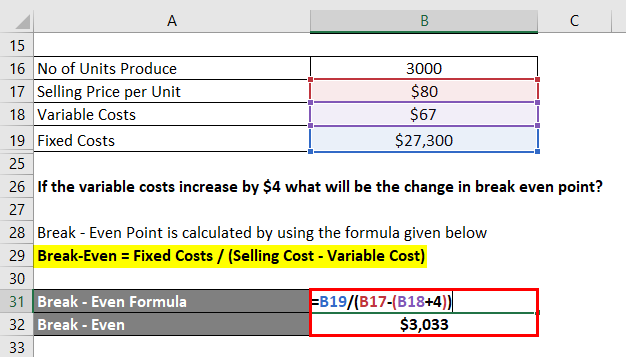
- Break-Even = Fixed Cost / (Selling Price – variable Costs)
- Break-Even = 27300 / (80 – 71)
- Break-Even = 3033
Break Even Analysis Example – #4
Let us now look at an example where we will calculate the break-even point for multiple products.
Cafe Brew wants to calculate the break-even point for next year based on the data given below. As indicated below, 50% of revenue comes from selling coffee, and the remaining 50% comes from selling chocolate and latte. The respective selling price are given below
In the second table, we have variable costs related to each product and the total fixed costs of $55000
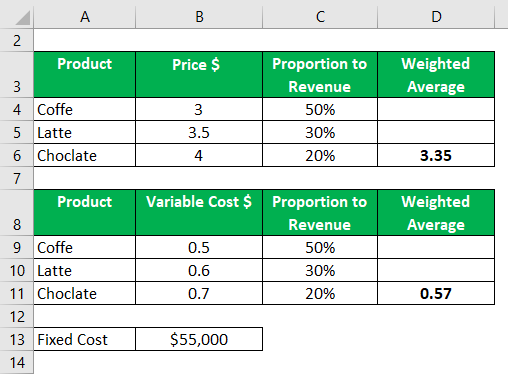
The weighted average price is calculated by multiplying each weight with the price and by summing up all these values.
Weighted Average Price is calculated as
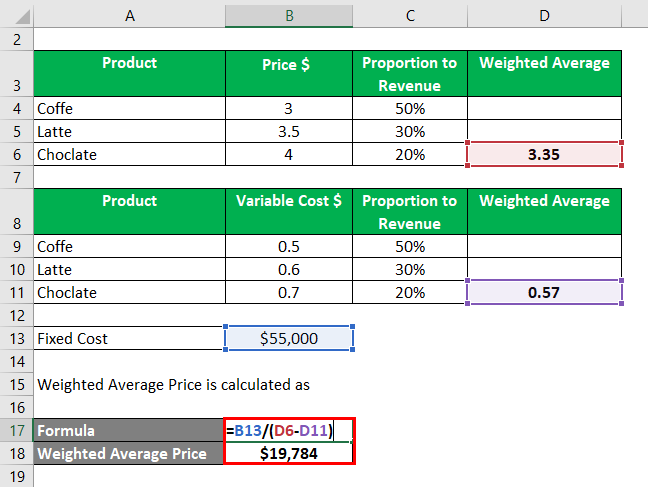
- Weighted Average Price = $55000 / ($3.35 – $0.57)
- Weighted Average Price = 19784 units
Conclusion
Break even analysis may be a useful tool, but it has its limitations. It is often criticized for being too simplistic and based on unrealistic assumptions.
For example, it assumes that all the output or the stock is sold and no stock is left. However, in reality, many business stocks pile their inventory. It assumes that the conditions remain the same. Moreover, the calculation depends on the accuracy of the data. In the case of a multi-product business, there may be many variable costs at one time.
Recommended Articles
This is a guide to Break Even Analysis Example. Here we discuss how Break-Even can be calculated by using a formula with examples and a downloadable Excel template. You can also go through our other suggested articles to learn more –


