Updated July 21, 2023

Definition of Calmar Ratio
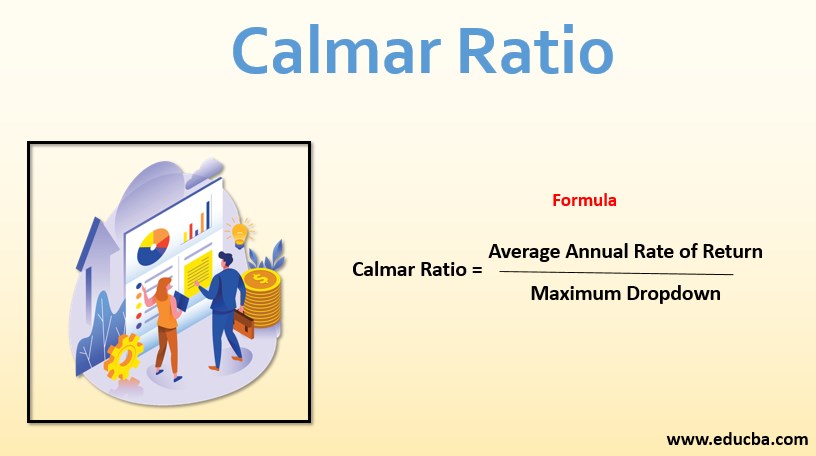
The Calmar Ratio is a risk-adjusted key performance metric for commodity and hedge funds, which conveys the amount of return a fund has generated with respect to the risk the investment has borne, therefore it measures the return per unit of risk and lets the investor decide whether the given amount of return is worth it at the given level of risk or not. The Calmar ratio is also known as the drawdown ratio.
Formula
Or we at times also see the following formula for Calmar ratio:
Where,
- Rp: Portfolio Return
- Rf: Risk-Free Return
Example of Calmar Ratio (With Excel Template)
Let’s take an example to understand the calculation in a better manner.
Example #1
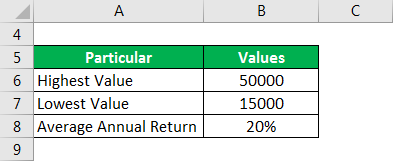
Let’s suppose that a fund started 3 years ago with an initial investment of $20000 and over these 5 years it reached a value of $50000 but went as low as $15000 in times of the unstable economy. Over these years the average annual return was 20% and we want to calculate the Calmar ratio:
Solution:
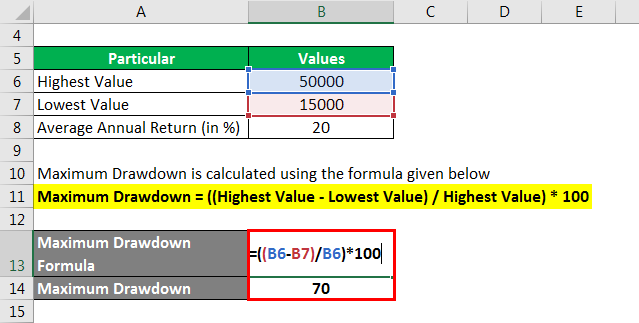
Maximum Drawdown is calculated using the formula given below
Maximum Drawdown = ((Highest Value – Lowest Value) / Highest Value) * 100
- Maximum Drawdown = ((50000 – 15000) / 50000)*100
- Maximum Drawdown = 70%
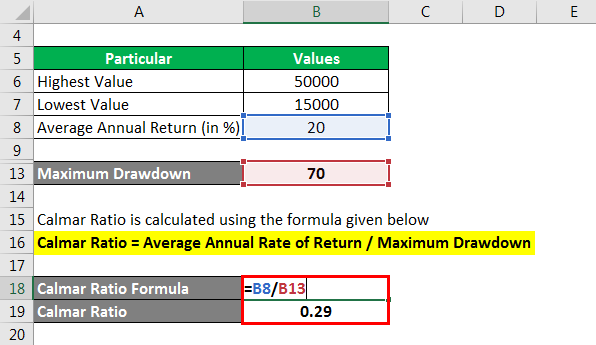
Calmar Ratio is calculated using the formula given below
Calmar Ratio = Average Annual Rate of Return / Maximum Drawdown
- Calmar Ratio = 20 / 70
- Calmar Ratio = 0.29
So the risk-adjusted ratio is 0.29 and this will help in evaluating whether a fund is worth investing. Suppose the investor has a criterion of a minimum Calmar ratio of 0.35, so this ratio is not worth investing in.
Further, we may even use to compare it to another fund which has a Calmar ratio of 0.32, and therefore has a higher risk-adjusted return and should be selected over this fund whose Calmar ratio is only 0.29
Explanation
The formula for Calmar Ratio can be calculated by using the following points:
- Over a period of time, the fund has risen and falls in its returns, the highest return is considered the peak and for every lower return, the drawdown is calculated to see how much has the return fallen from the peak return. The peak return remains to be peak till the time a higher return is achieved, which then becomes the peak of the investment and all-new drawdowns are calculated from this new peak.
- Just because an investment gives a very high return, it is not justified to invest in the same because the investor also needs to look at the amount of risk he has to bear to gain that return and if such a risk level is not within the permissible limits of his Investor Policy Statement (IPS), then even if the return is very high, the investor should not invest in it.
- There are many measures that give the same information such as, the Sharpe ratio, Sortino Ratio Treynor ratio in different domains of investment such as stocks, bonds, derivatives and so on. Calmar is short for California Managed Accounts Report and is very similar to MAR ratio which has pre-existed it.
Uses of Calmar Ratio
- Compare Funds: As explained in the example above, if an investor has two funds in front of him then the fund with a higher ratio should be selected if all other things are identical for the two funds, because of higher the Calmar ratio, higher the risk-adjusted returns
- Applicable in Mutual funds, Hedge funds, Commodity trading
- Retrospective analysis: The Calmar ratio is used by the investment managers to analyze past strategies and understand what can be done better in future strategies.
Calmar Ratio vs Sharpe Ratio
Below are the points explain the difference between:
1. The formula for Sharpe Ratio is:
Where,
- Rp: Portfolio Return
- Rf: Risk-Free Return
- σp: Standard Deviation of Portfolio
2. Sharpe ratio uses standard deviation for risk to risk adjust the return while the Calmar ratio uses the maximum drawdown for risk
3. Sharpe ratio is more popular than the Calmar ratio
4. Sharpe ratio was developed in 1966 while the Calmar ratio was first published in 1991
Advantages and Disadvantages of Calmar Ratio
Below are the benefits and limitation of the same:
Advantages
- IPS Conformity: This is an empirical metric that helps in figuring out whether an investment in the fund is conforming to the risk and return objectives of the IPS. If this is not the case then the investor should not invest in the given fund
- Risk-Adjusted Measure: A fund which has a higher return but the risk is also very high can’t be judged on the basis of return in isolation, therefore as Calmar ratio is a risk-adjusted measure, it presents a clearer picture of the investment and helps the investor in making an informed decision
- Acts as a reality check for the Investment Manager: An investment manager looks at the Calmar ratio of the other funds in the same industry or sector and compare what he can do better if other funds have a lower ratio or what is creating his distinctive edge if his fund has a higher ratio so that he may continue with the same investment strategy
Disadvantages
- Maximum Drawdown: Maximum drawdown could be a really harsh measure for the risk input because a fund may have hit real lows during crisis periods which have an outlier effect on the amount of risk that is being assumed as compared to the amount of risk that is actually there from investing in the fund. Removing such outlier effect and normalizing the return data set would be a much prudent approach of analyzing the fund
- Past Performance: It looks at past performance and not the estimates of the future and assumes that the same performance will continue in the future, which might not be the case in changing economic environment
- Less Popular: As this is a recent development, it is comparatively less popular in the investing community
Conclusion
Calmar ratio is a risk-adjusted measure to see how a hedge fund or commodity trading fund is performing and whether it is worth investing in the same. As it considers return per unit of risk, it is a better measure than just looking at the risk number in isolation.
However, the use of maximum drawdown as a measure of risk is at times unwarranted because it is way too harsh and it would be better to use standard deviation instead, which would remove the impact of the outliers.
Recommended Articles
This is a guide to the Calmar Ratio. Here we discuss how to calculate along with practical examples. We also provide a downloadable excel template. You may also look at the following articles to learn more –


