Updated July 21, 2023

What is CAPE Ratio?
CAPE Ratio, abbreviated form for Cyclically-Adjusted Price to Earnings Ratio, is used as a valuation tool to measure the relationship between the company’s earnings per share over a period of 10 years and company’s stock price flushing out all the fluctuations which may occur in the company’s profits during various business cycles and different periods and seasons.
Formula
The formula for CAPE ratio is:
Explanation
CAPE ratio is considered to be a valuation measure which takes into consideration the effect of a company’s earning over a period of a decade post considering the effect of inflation and its simultaneous relation with that company’s stock price in the market. The utmost important point here is that the CAPE ratio can be also applied to any type of indices to get an idea about whether the market is over-valued or under-valued.
This is also referred to as the Shiller P/E ratio, as it was largely popularized by a professor of Yale University, namely, Robert Shiller.
Example of CAPE Ratio (With Excel Template)
Let’s take an example to understand the calculation in a better manner.
Example #1
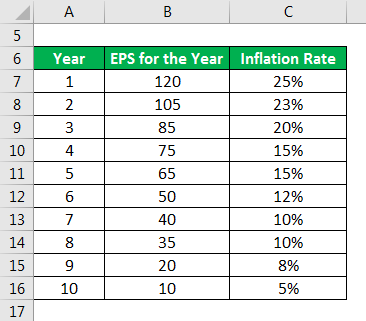
Carivacous Ltd is listed in a stock exchange currently trading at $1500 per share. The current year EPS of the company is $125. Below given table provides details of earnings per share (EPS) of the past 10 years pertaining to the stock of Carivacous Ltd. Along with EPS, inflation rates are provided pertaining to the specified years respectively. Calculate the CAPE ratio for Carivacous Ltd.
Solution:
PE Ratio is calculated using the formula given below
PE Ratio = Market Price / EPS
- PE Ratio = 1500 / 125
- PE Ratio = 12
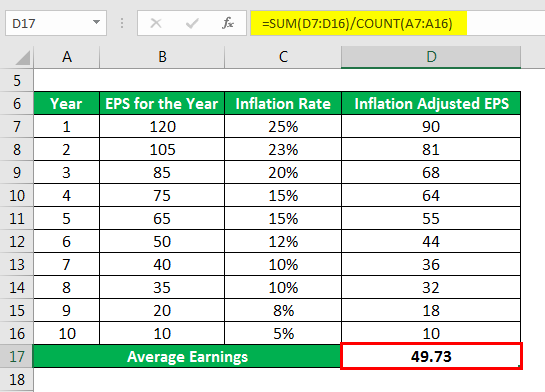
10-Years Average Earnings Per Share Adjusted for Inflation is calculated as
CAPE Ratio is calculated using the formula given below
CAPE Ratio = Stock Price / 10-Years Average Earnings Per Share Adjusted for Inflation
- CAPE Ratio = 1500 / 49.73
- CAPE Ratio = 30.16
Thus, it can be seen that although the PE for the stock for the current year is 12, its CAPE ratio is at 30. Alternatively, you can also say that the stock is overvalued.
Example #2
Let us take a different example to understand the valuation aspect of a stock or index. Now, consider that an Index has a PE ratio of, say 20 with a historical PE ratio of 24. Now, post computing the CAPE ratio (as explained in the earlier example), the CAPE ratio for the index stands at 34. Please give an explanation of the valuation of the index.
Solution:
In the case at hand, it is pertinent to note that the current PE of the Index, 20, is very similar or nearby to its historical PE, which is at 24.
Now, you may note that the historical PE is a formula to calculate average PE of the stock or index over the period of 10 years as a simple average. On the other hand, the CAPE ratio stands at 34, which takes into consideration the inflation and cyclical impact of the EPS over a period of 10 years. Even after such adjusted, the CAPE ratio is fairly higher than the current PE and historical PE, which makes the index quite overvalued and risky to be invested in.
Uses of CAPE Ratio
- It is mainly used as a financial tool to analyze the PE ratio of a company or index post considers the impact of cyclical changes in the economy over a period of 10 years.
- Apart from being used as a financial tool, the CAPE ratio is used to determine whether the stock of a listed company is over-valued or under-valued, as it is quite similar to the PE ratio.
- A consistent analysis of the CAPE ratio will be useful as a tool for analyzing the future trends and patterns of the stock or index, as the case may be.
Advantages and Disadvantages of CAPE Ratio
Below we will learn about the limitation and benefits of CAPE ratio:
Advantages
Given below are the main benefits of CAPE ratio:
- It is a very simple mathematical formula and thus easy to calculate by anyone having a basic knowledge of finance;
- Due to the fact that this ratio considers the average value of EPS over a period of time, it balances out the effect of any cyclical returns the company may generate and thus gives a better picture of the earnings by the company;
- It takes into consideration the impact of inflation on the economy.
Disadvantages
Though there are some advantages and benefits of using as a financial analysis tool, there are certain disadvantages or rather we can say certain areas of concern when using the CAPE ratio as a measure of the analysis tool. Given below are certain areas of concern when using the CAPE ratio for analyzing any company.
- The main concern is that the ratio considers an average of earnings for a period of 10 years. In a practical scenario, there are various changes that a business may undergo in such a long timeframe and thus affecting the way business is being carried on for over the years. In such a situation, it may not be right to compare a business today with what it was a decade ago;
- In addition to the above point, it needs to be noted that the law governing the business changes massively over such long timeframe and making an impact of the way business is being carried on;
- It may be noted that there are various companies that declare and pay dividends to their shareholders. Ratio is completely independent of this and does not take into account any dividend numbers;
- Another point that is important and yet not considered while computing the ratio is that the market keeps fluctuating and so does the demand market of a particular stock.
Conclusion
To conclude the whole discussion, it shall be right to say that the CAPE ratio is a tool or method to measure the valuation aspect of any stock or index. It provides an answer in the form of whether the stock or index is over-valued or under-valued. It takes into consideration the impact from an economics point of view and also of the fact of any cyclical changes which may affect stock or index and thus it a better measure to get an insight about future returns of the stock or index in question.
Recommended Articles
This is a guide to the CAPE Ratio. Here we discuss how to calculate the cape ratio along with practical examples. We also provide a downloadable excel template. You may also look at the following articles to learn more –


