Updated July 26, 2023
Definition of Cash Flow from Operations Ratio
The term “cash flow from operations ratio” describes a coverage ratio that evaluates how effectively the cash flow generated from the company’s operations can satisfy its current liabilities.
In other words, the liquidity ratio measures a company’s ability to cover its short-term financial obligations with its operating cash flow or earnings from operations per dollar of current liability. This ratio can be very helpful with other liquidity ratios like cash, quick, current, etc.
Formula
The formula for CFO Ratio is represented as,
The cash flow from operations is either easily available from the cash flow statement or can be computed by adding net income, non-cash charges, and change in working capital. At the same time, current liabilities include trade payables, accrued expenses, the current portion of long-term debt, short-term borrowing, etc.
Examples of Cash Flow From Operations Ratio (With Excel Template)
Let’s take an example to understand the calculation of the CFO Ratio formula in a better manner.
Example – #1
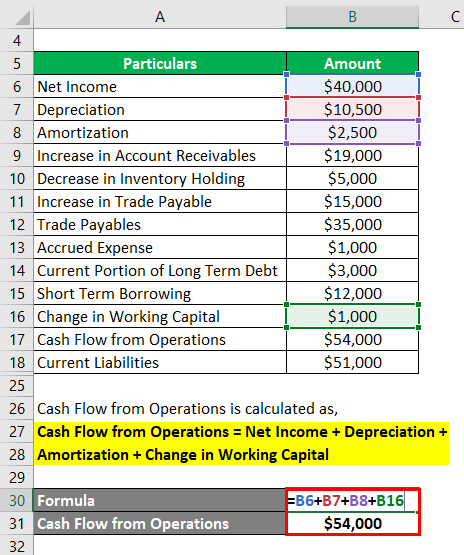
Let us take the example of the company JKL Inc. wholesale furniture trading in California. Recently the company has published its annual report, and the following financial information has been made available:
Solution:
Change in Working Capital is calculated as,
Change in Working Capital = ( – Increase in Account Receivables + Decrease in Inventory Holding + Increase in Trade Payable)
- Change in Working Capital = – $19,000 + $5,000 + $15,000
- Change in Working Capital = $1,000
Cash Flow from Operations is calculated as,
Cash Flow from Operations = Net Income + Depreciation + Amortization + Change in Working Capital
- CFO = $40,000 + $10,500 + $2,500 + $1,000
- CFO = $54,000
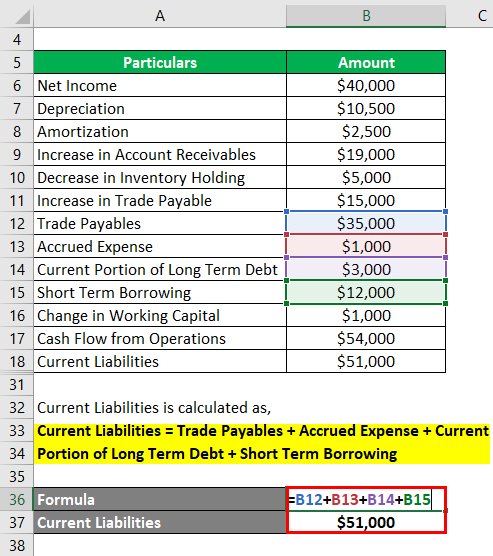
Current Liabilities is calculated as,
Current Liabilities = Trade Payables + Accrued Expense + Current Portion of Long Term Debt + Short Term Borrowing
- Current Liabilities = $35,000 + $1,000 + $3,000 + $12,000
- Current Liabilities = $51,000
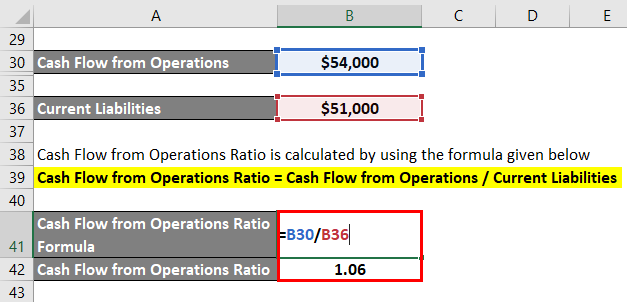
CFO Ratio is calculated by using the formula given below
Cash Flow from Operations Ratio = Cash Flow from Operations / Current Liabilities
- CFO Ratio = $54,000 / $51,000
- CFO Ratio = 1.06
Therefore, JKL Ltd has a cash flow ratio of 1.06, which indicates that the company earns S1.06 from operating activities for every dollar of current liabilities.
Example – #2
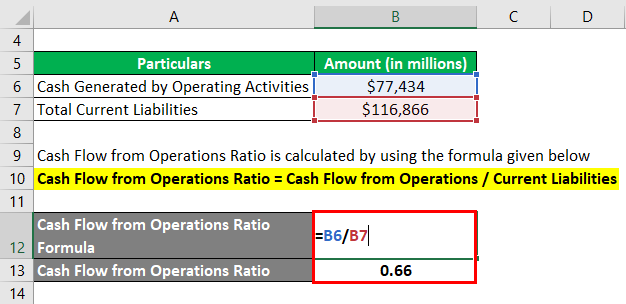
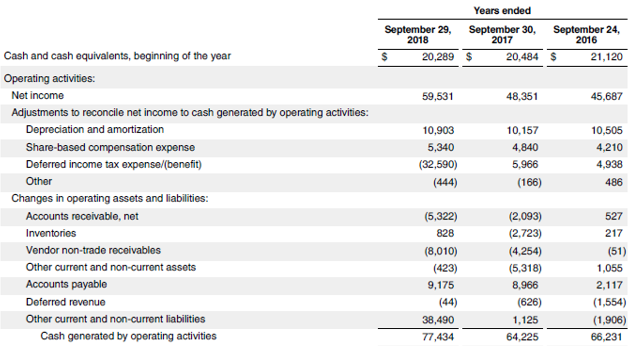
Let us take the example of Apple Inc. to calculate the cash flow from operations ratio based on the annual report for the year ended on September 29, 2018. The following information is available:
Solution:
CFO Ratio is calculated by using the formula given below
Cash Flow from Operations Ratio = Cash Flow from Operations / Current Liabilities
- CFO Ratio = $77,434 Mn / $116,866 Mn
- CFO Ratio = 0.66
Therefore, Apple Inc. had a cash flow ratio of 0.66, which indicates that it can cover up to 66% of the current liabilities with its cash flow from operating activities.
Source: Apple’s Annual Report
Example – #3
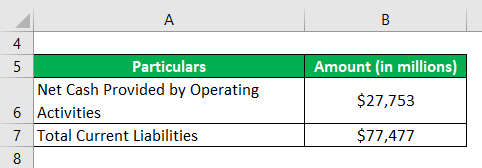
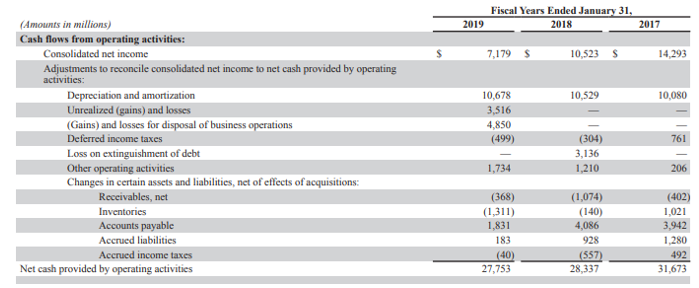
Let us take the example of Walmart, a multinational supermarket chain. Calculate the cash flow from operations ratio for Walmart based on the financial information from the annual report for 2019:
Solution:
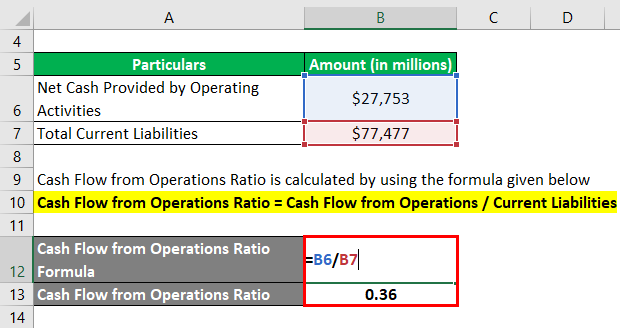
CFO Ratio is calculated by using the formula given below
Cash Flow from Operations Ratio = Cash Flow from Operations / Current Liabilities
- CFO Ratio = $27,753 Mn / $77,477 Mn
- CFO Ratio = 0.36
Therefore, Walmart had a cash flow ratio of 0.36, which indicates that it can cover up to 36% of its current liabilities with its cash flow from operating activities.
Source: Walmart Annual Reports (Investor Relations)
Advantages and Disadvantages of CFO Ratio
Some of the advantages and disadvantages of the CFO Ratio are as follows:
Advantages
The advantage of the CFO Ratio is that it is much better than most other liquidity ratios because it assesses the liquidity coverage based on cash generated from the core business operation.
Disadvantages
The disadvantage of the CFO Ratio is that this ratio is vulnerable to manipulation by companies. However, the manipulations are not as easy as it is in the case of net income.
Conclusion
So, this is another liquidity metric that measures how well the operating cash flow of a company can cover its current liabilities. The higher the ratio value, the better the company’s liquidity position.
Recommended Articles
This is a guide to the Cash Flow From Operations Ratio. We discuss the introduction, the top 3 examples, advantages and disadvantages, and a downloadable Excel template. You can also go through our other suggested articles to learn more –


