Updated May 26, 2023
Coefficient of Determination Formula (Table of Contents)
What is the Coefficient of Determination Formula?
In statistics, the coefficient of determination, also termed R2, determines and assesses a statistical model’s ability to explain and predict future outcomes. In other words, if we have the dependent variable y and independent variable x in a model, then R2 helps determine the variation in y by variation x. It is a key output of regression analysis used to predict the future or test some models with related information. The value of R2 lies between 0 and 1, and the higher the value of R2, the better the prediction and strength of the model. R2 is very similar to the correlation coefficient since the correlation coefficient measures the direct association of two variables. R2 is a square of a correlation coefficient.
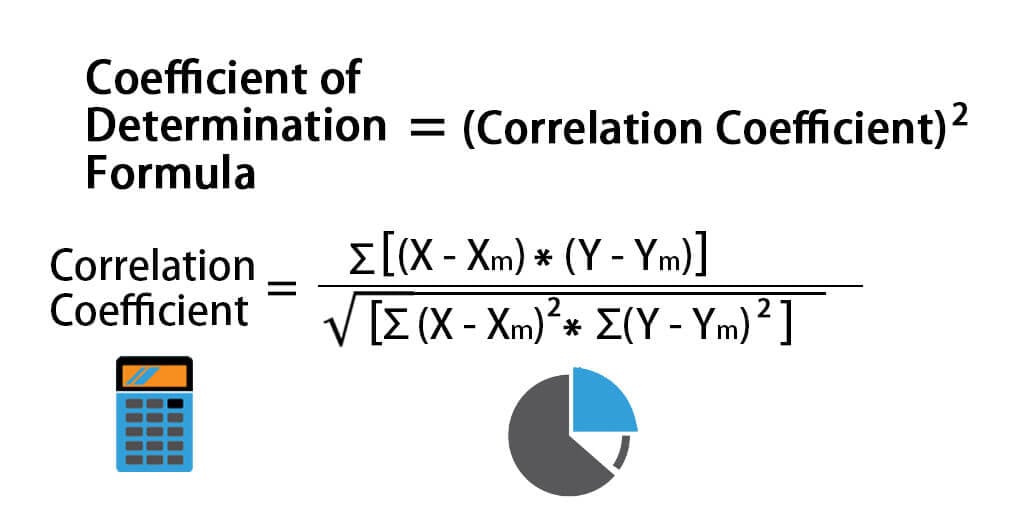
Formula For Coefficient of Determination:
There are multiple Formulas to calculate the coefficient of determination:
- Using the Correlation Coefficient :
Where:
- X – Data points in Data set X
- Y – Data points in Data set Y
- Xm – Mean of Data set X
- Ym – Mean of Data set Y
So
- Using Regression outputs
Coefficient of Determination (R2) = Explained Variation / Total Variation
Coefficient of Determination (R2) = MSS / TSS
Where:
- TSS – Total Sum of Squares = Σ (Yi – Ym)2
- MSS – Model Sum of Squares = Σ (Y^ – Ym)2
- RSS – Residual Sum of Squares =Σ (Yi – Y^)2
Y^ is the predicted value of the model, Yi is the ith value, and Ym is the mean value
Examples of Coefficient of Determination Formula (With Excel Template)
Let’s take an example to understand the calculation of the Coefficient of Determination in a better manner.
Coefficient of Determination Formula – Example #1
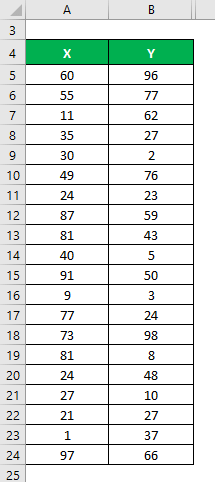
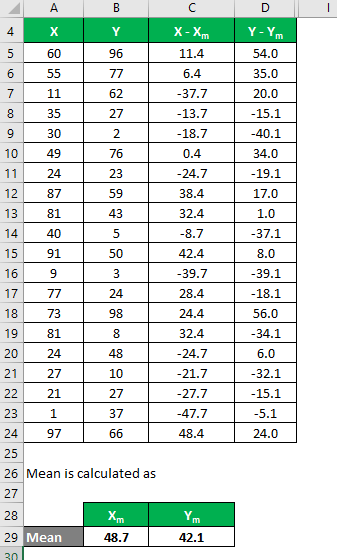
Let’s say we have two data sets, X & Y, each containing 20 random data points. Calculate the Coefficient of Determination for the data set X & Y.
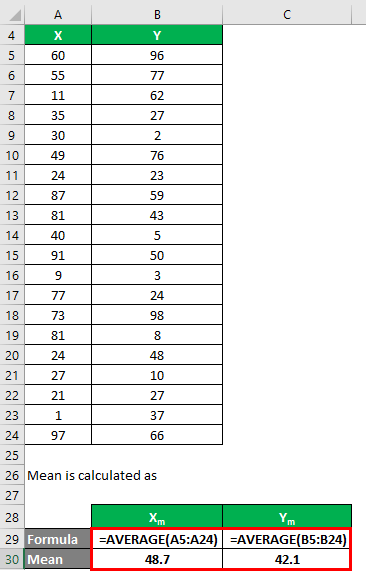
The mean is calculated as follows:
- Mean of Data Set X = 48.7
- Mean of Data Set Y = 42.1
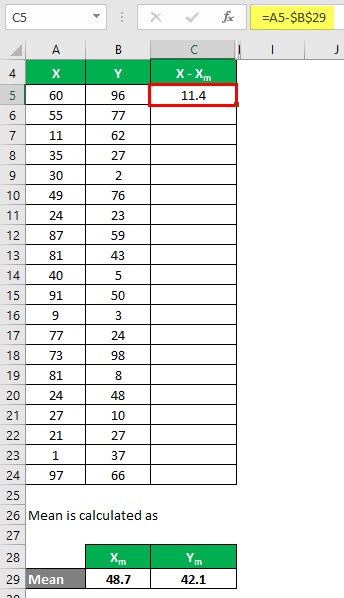
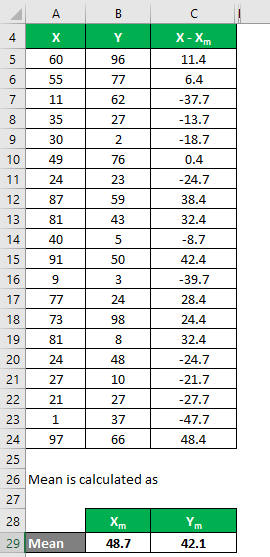
We must calculate the difference between the data points and the mean value.
Similarly, calculate for all the data sets of X.
Similarly, calculate it for data set Y also.
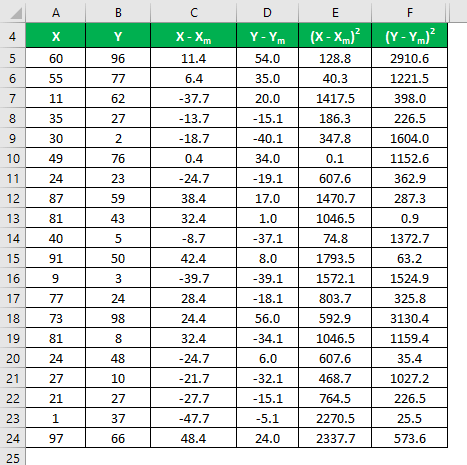
Calculate the square of the difference for both the data sets, X and Y.
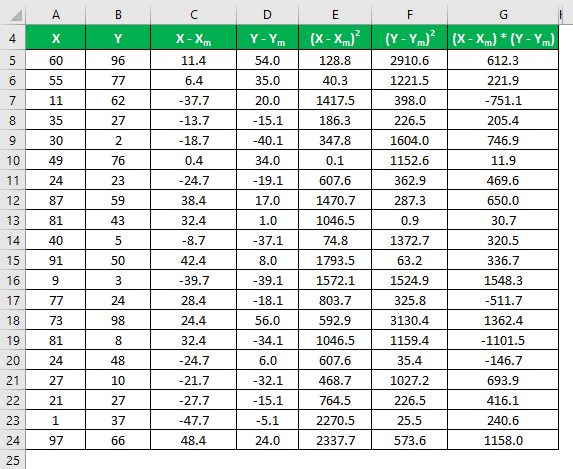
Multiply the difference in X with Y.
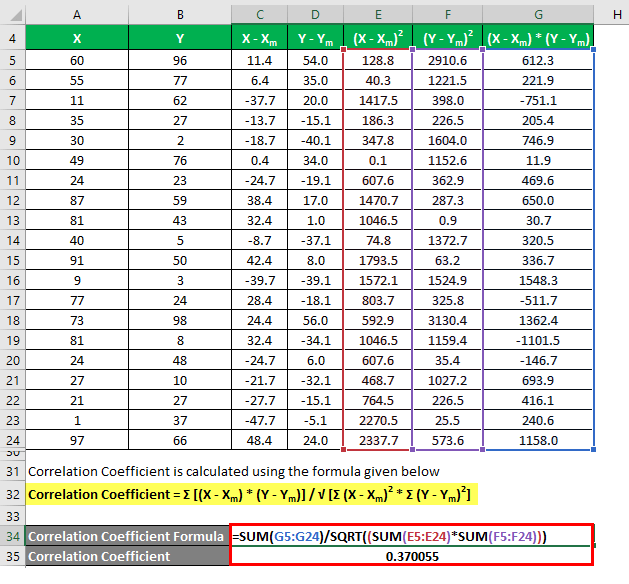
The correlation coefficient is calculated using the formula given below
Correlation Coefficient = Σ [(X – Xm) * (Y – Ym)] / √ [Σ (X – Xm)2 * Σ (Y – Ym)2]
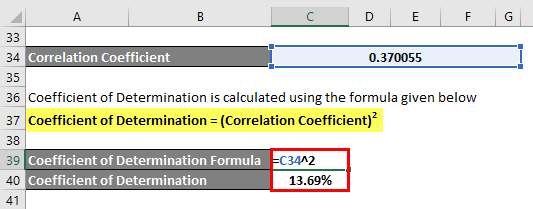
The coefficient of determination is calculated using the formula given below
Coefficient of Determination = (Correlation Coefficient)2
Coefficient of Determination = 13.69%
Coefficient of Determination Formula – Example #2
Let’s say you are a risk-averse investor looking to invest money in the stock market. You are unsure which stocks to invest in, and your risk appetite is low. So you want to invest in a safe stock that can mimic the index’s performance. Your friend, an active investor, has shortlisted 3 stocks for you based on their fundamental and technical information, and you want to choose 2 stocks among those three.
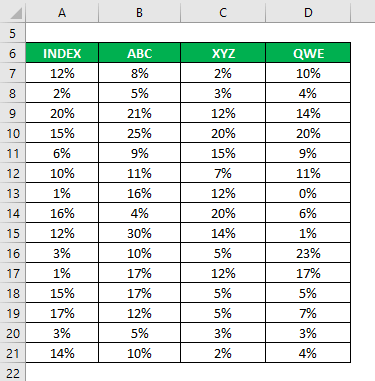
You have also collected information about their historical returns for the last 15 years.
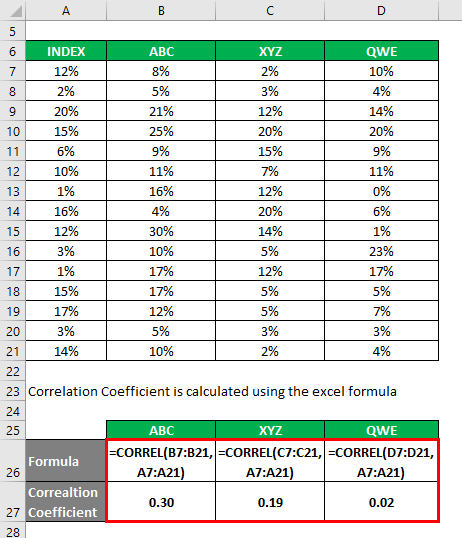
The correlation coefficient is calculated using the Excel formula
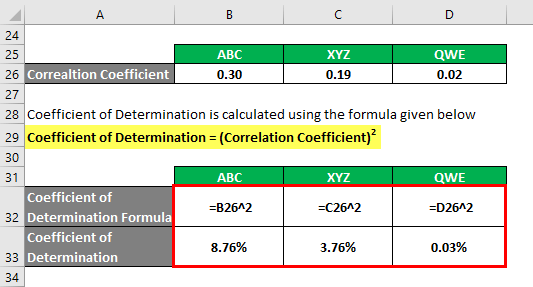
The coefficient of determination is calculated using the formula given below
Coefficient of Determination = (Correlation Coefficient)2
Based on the information, you will choose stock ABC and XYZ to invest in since they have the highest coefficient of determination.
Explanation
As explained above, the coefficient of determination is the square of the correlation between two data sets. If R2 is 0, there is no correlation, and the independent variable cannot predict the value of the dependent variable. Similarly, if its value is 1, the independent variable will always be successful in predicting the dependent variable. But there are some limitations also. Although it tells us the correlation between 2 data sets, it does not tell us whether that value is enough or not.
Also, a significant value of R2 does not always imply that the 2 variables have strong relationships and can be a fluke. For example, the R2 value between the number of cars sold in a year and the number of ice cream boxes sold in a year is 80%. But there is no relation between these two. So one should be careful while using R2, understand the data first, and then apply the method.
Relevance and Use of Coefficient of Determination Formula
There are many practical applications of R2. For example, R2 is very commonly used by investors to compare the performance of their portfolio with the market and try to predict future directions. Similarly, Hedge Funds use R2 to help them to model the risk in their models. But ultimately, the outcome is based on pure numbers and statistics, which can be misleading sometimes. As mentioned above, one needs to check first if the output of the R2 makes sense in real life or not.
Recommended Articles
This has been a guide to the Coefficient of Determination Formula. Here we discuss how to calculate the Coefficient of Determination along with practical examples and a downloadable Excel template. You may also look at the following articles to learn more –
