Definition of Data Manipulation with Python
Data manipulation with python is defined as a process in the python programming language that enables users in data organization in order to make reading or interpreting the insights from the data more structured and comprises of having better design. For example, arranging the employee’s names in alphabetical order will enable quicker searching of a particular employee by their name. The key feature of data manipulation is enabling faster business operations and also emphasize optimization in the process. Through proper manipulated data one can analyze trends, interpret insights from financial data, analyze consumer behaviour or pattern, etc. Not only the analyzing, but it also enables users to neglect any unnecessary data in the set so that one can save space and only fill the limited space with important and necessary data. In this article, we will look into the different methods of manipulation in python and also look into the examples
Data Manipulation Methods with Python
Python has been the most famous and most used language amongst developers in order to manipulate data in a dataset. With open-source implementations in Python, we have various methods that help in the implementation of the manipulation methods in Python. For all the following methods we would first need to install pandas in python and that can be achieved by running the following command in the command prompt:
pip install pandasOnce the pandas package is installed in the system, we would need to import the pandas library into our codebase by running:
import pandas as pdThe reason one would use pd is to make sure that we can use the short form wherever we would need to call the corresponding package. Now that we have installed and imported the pandas library, we would use one of its functions to read the CSV file and then store the return dataset into a variable. we would run the following code:
variable_name = pd.read_csv("file name.csv")With this, we are all ready to explore the different methods of data manipulation with python and also look into the practical aspects of the same with live examples in the next section.
1. Filtering values on the basis of given condition:
In order to only work with specific data that meets the criteria as set by the guidelines, we would need to use the corresponding data manipulation to adhere to the conditions. In this data manipulation technique, we would use the .loc function which allows access of a group of rows and/or columns using Boolean array or labels.
2. Apply a certain function to create either a new variable or perform related operations:
In order to apply a particular function across rows or columns, we would use the. apply function as available in pandas. This function applies the corresponding declared function to the respective axis (0 for column and 1 for rows) and finally return the required variable as per the requirement.
3. Using a pivot function to aggregate across the desired column:
This method works similar to the pivot functionality in excel. Here we would pivot our data across the index and perform the required aggregation on other columns as per the requirement. The function we use here is .pivot.
4. Functionality of crosstab:
Using the function crosstab, one would be able to get an original view of the data. using this functionality one can validate some underlying hypothesis one would have by looking at the problem statement and initial part of the data.
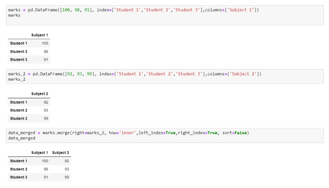
5. Merge of 2 tables:
In normal real-life scenarios, it is nearly impossible to have all the data residing in one data table, and hence this functionality comes in very handy to merge 2 datasets on the basis of a key and can be declared as a parameter in the function “.merge”.
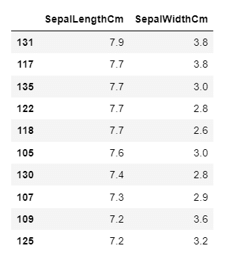
6. Sorting a table:
Using this data manipulation we can sort a table on the basis of keys that will be passed as parameters to the function “.sort_values”. One can also pass a list of columns and on the basis of the chronological order, the table would get sorted.
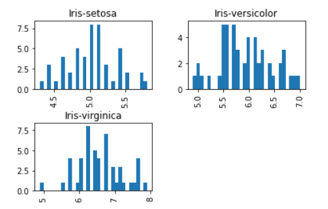
7. Plotting of boxplots and histograms:
The final manipulation of this list, which is visually very interesting to explain the dataset is to plot boxplot and histogram in order to understand the different statistical parameters of the data and its inference. For example, using a boxplot we can easily visualize the number of outlier points in a dataset. Using histogram one can determine the distribution of the data and its spread!
For our examples below, we would use 2 publicly available dataset i.e. the iris dataset and the titanic dataset! When the variable in the examples refers to data, we would be referring to the iris dataset!
Examples
Let us discuss examples of Data Manipulation with Python.
Example #1
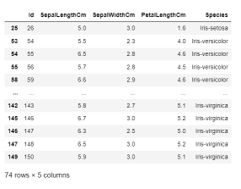
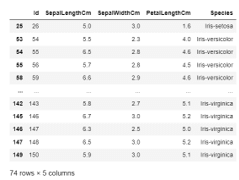
Getting rows on the basis of conditions on specific columns:
Syntax:
data.loc[(data["SepalLengthCm"]>=5) & (data["SepalWidthCm"]<=3) & (data["PetalLengthCm"]>1.2), ["Id", "SepalLengthCm", "SepalWidthCm", "PetalLengthCm", "Species"]]Output:
Example #2
Creation of new variable using the apply function:
Syntax:
def missingValues(x):
    return sum(x.isnull())
print("Number of missing elements column wise:")
print(data.apply(missingValues, axis=0))
print("\nNumber of missing elements row wise:")
print(data.apply(missingValues, axis=1).head())
Output:
Example #3
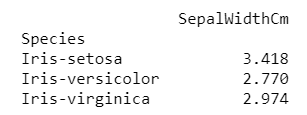
Finding the average of the Sepal Width per category of species using pivot table:
Syntax:
import numpy as np
pivot_table = data.pivot_table(values=["SepalWidthCm"], index=["Species"], aggfunc=np.mean)
print(pivot_table)
Output:
Example #4
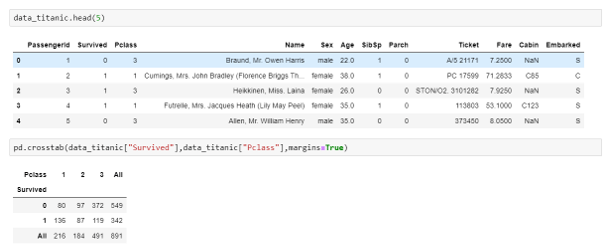
Finding spread of data across 2 categorical columns:
Syntax:
import pandas as pd
data_titanic = pd.read_csv("train.csv")
pd.crosstab(data_titanic["Survived"],data_titanic["Pclass"],margins=True)
Output:
Example #5
Merge 2 table on the basis of indexes of respective tables:
Syntax:
marks = pd.DataFrame([100, 98, 91], index=['Student 1','Student 2','Student 3'],columns=['Subject 1'])
marks
marks_2 = pd.DataFrame([92, 93, 99], index=['Student 1', 'Student 2', 'Student 3'],columns=['Subject 2'])
marks_2
data_merged = marks.merge(right=marks_2, how='inner', left_index=True, right_index=True, sort=False)
data_merged
Output:
Example #6
Arrange a table in descending form, through multiple columns prioritizing one column first and then the other:
Syntax:
data_sorted = data.sort_values(['SepalLengthCm','SepalWidthCm'], ascending=False)
data_sorted[['SepalLengthCm','SepalWidthCm']].head(10)
Output:
Example #7
Plot boxplot on the Iris dataset:
Syntax:
import matplotlib.pyplot as plt
%matplotlib inline
data.boxplot(column="SepalLengthCm",by="Species")
Output:
Example #8
Plot histogram on the Iris dataset:
Syntax:
import matplotlib.pyplot as plt
%matplotlib inline
data.hist(column="SepalLengthCm",by="Species",bins=30)
Output:
Conclusion
With the help of this article, we have looked at the possible methods of manipulation along with respective examples of each. Though these are not an exhaustive list, we have tried to cover the maximum coverage of methods widely used in the industry. One can experiment with others and it is obviously a need to learn more!
Recommended Articles
This is a guide to Data Manipulation with Python. Here we discuss the definition, syntax, Data manipulation methods with python, and examples for better understanding. You may also have a look at the following articles to learn more –
