Updated March 20, 2023

Introduction to Data Science Tools
A data scientist shall extract, manipulate, pre-process and generate information forecasts. To do this, it needs different statistical instruments and languages of programming. In this article, we will discuss some data science tools that data scientists use to conduct data transactions and that we will understand the main features of the tools, their benefits, and the comparison of different data science tools.
So here we will be going to discuss data science. So, basically, we can say that As one of the most famous fields of the 21st century is data science. Companies employ data scientists to give them insights into the industry and improve their products. Data Scientists are responsible for analysing and managing a wide range of unstructured and structured data and are the decision-makers. To do so, Data Science must adapt the day in the manner it wishes to use different tools and programming language. We will use some of these tools for analyzing and generating projections. So now, we will discuss the data science tool.
Top Data Science Tools
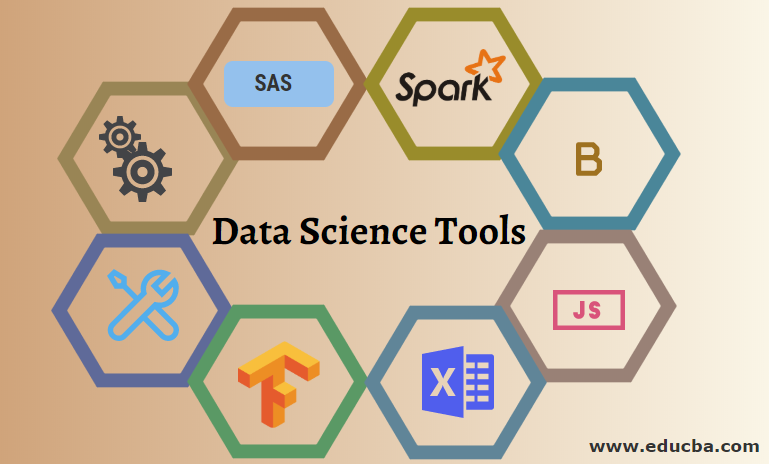
The following is a list of the 14 best data science tools used by most data scientists:
1. SAS
It is one of those information scientific instruments designed purely for statistical purposes. SAS is proprietary closed-source software for analyzing information by big companies. For statistical modelling, SAS utilizes basic SAS language programming. It is commonly used in commercial software by experts and businesses. As a data scientist, SAS provides countless statistical libraries and instruments to model and organize data. Although SAS is highly trustable and has strong support, it is high in cost and used only by larger industries. Moreover, several SAS libraries and packages are not in the base package and can be upgraded costly.
Features of SAS:
- Management
- Report output format
- Data encryption algorithm
- SAS studio
- Supports for various types of data formats
- It has flexible for the 4th gen of programming language
2. Apache Spark
Apache Spark, or simply political Spark, is a powerful analytics engine and the most commonly used Data Science instrument. Spark is intended specifically for batch and stream processing. Many APIs allow information scientists to access machine learning information, SQL storage, etc., repeatedly. It improves over Hadoop and is 100 times quicker than Map-Reduce. Spark has many Machine Learning APIs that help data scientists to predict the information. Spark can manage streaming information better than other Big Data platforms. Spark can process information in real-time compared to other analytical tools that only process historical information in batches. In Python, Java, and R, Spark provides several APIs. However, Spark’s most strong combination with Scala is a virtual Java-based programming language, which is cross-platform in nature.
Features of Apache Spark:
- Apache Spark has great speed.
- It also has an advanced analytics.
- Apache spark also has a real-time stream processing.
- Dynamic in nature.
- It also has a fault tolerance.
3. BigML
BigML, another data science tool that is used very much. It offers an interactive, cloud-based GUI environment for machine algorithm processing. BigML offers standardized cloud-based software for the sector. It allows businesses throughout multiple areas of their enterprise to use Machine Learning algorithms. BigML is an advanced modelling specialist. It utilizes a large range of algorithms for machine learning, including clustering and classification. You can create a free account or premium account based on your information needs using the BigML web interface using Rest APIs. It enables interactive information views and gives you the capacity to export visual diagrams on your mobile or IoT devices. In addition to this, BigML comes with multiple automation techniques to automate the tuning and even automate reusable scripts.
4. D3.js
Javascript is mostly used as a scripting language on the client side. D3.js, you can create interactive visualizations on our web browser through the Javascript library. With various D3.js APIs, you can make dynamic viewing and data analysis in your browser using various features. The use of animated transitions is another strong characteristic of D3.js. D3.js dynamically enables customer-side updates and actively reflects visualization on the browser through information modification. This can be combined with CSS to produce illustrated and temporary visualizations to assist you to execute tailor-made graphics on web pages. Overall, this can be a beneficial tool for IoT-based information scientists who need customer-side interaction for visualization and information processing.
Features of the D3.js:
- It is based on javaScript.
- It can create animated transition.
- It is useful for client-side interaction in IoT.
- It is open source.
- It can be combined with CSS.
- It is useful for making interactive visualizations.
5. MatLab
For mathematical information, Matlab is a multi-paradigm number system computing environment. It is a closed-source software that facilitates matrix, algorithm, and statistical information modelling. In several science fields, Matlab is most commonly used. Matlab is used for neural networks and fuzzy logic simulations in data science. You can generate strong visualizations with the Matlab graphics library. In picture and signal processing, Matlab is also used. For information scientists, this makes it very versatile as it addresses all the issues, from analysis and cleaning to powerful deep learning algorithms. Also, Matlab is an optimal data science tool thanks to its simple inclusion into business apps and integrated systems. It also allows automating duties from information extraction to the re-use of decision-making scripts.
Features of Matlab:
- It is useful for deep learning.
- It provides easy integration with embedded system.
- It has a Powerful graphics library.
- It can Process complex mathematical operation.
6. Excel
The Data Analysis instrument probably most commonly used. Excel is created mainly to calculate sheets by Microsoft and is currently commonly used for data processing, complicated and visualization calculations. Excel is an efficient data science analytical instrument. Excel still packs a punch while it’s the traditional information analysis instrument. Excel has several formulas, tables, filters, slicers and so on. You can also generate your personalized features and formulae with Excel. While Excel is still an ideal option for powerful data visualization and tablets, it is not intended to calculate huge quantities of data.
You also can connect SQL to Excel and use it for data management and analysis. Many Data Scientists use Excel as an interactive graphical device for easy pre-processing of information. It’s now much simpler to calculate complicated analyzes with the launch of ToolPak on Microsoft Excel. But compared to much more sophisticated data studies instruments like SAS, it still fails. In general, Excel is an optimal instrument for data analytics at a tiny and non-enterprise level.
Features of Excel:
- For the small scale data analysis, it is trendy.
- Excel is also used for the spreadsheet calculation and visualization.
- Excel tool pack used for data analysis complex.
- It provides the easy Connection with the SQL.
7. NLTK
NLTK stands for Natural language processing. The most common sector in data science was natural language processing. It is about developing statistical models that assist machines in comprehending the language of human beings. These statistical models are components of machine learning and help computers understand natural language through several of its algorithms. Python language is equipped with the Natural Language Toolkit (NLTK) collection of libraries developed for this purpose alone. NLTK is commonly used for different language processing methods such as tokenizing, stemming, marking, parsing and machine learning. It comprises more than 100 companies that collect information on models for machine learning.
8. TensorFlow
TensorFlow has become a standard machine learning instrument. The latest machine learning algorithms, like Deep Learning, are commonly used. Developers have named TensorFlow after multidimensional arrays of tensors. It is an open-source and constantly evolutive toolbox known for its elevated computing efficiency and capability. TensorFlow can operate on both CPU and GPU and lately came into being on stronger TPU systems. TensorFlow has a wide range of applications due to its high processing capabilities, such as language recognition, image classification, the discovery of medicines, image generation and language generation.
Features of TensorFlow:
- TensorFlow can easily trainable.
- It also has future column.
- TensorFlow is an open source and flexible.
9. Weka
Weka or Waikato’s knowledge analysis environment is Java-written machine learning. The Machine Learning Algorithms are a set of several data mining machines. Weka includes different learning machines such as grading, clustering, regression, visualization, and information development. It is an open-source GUI software that makes it simpler and user-friendly to implement machine learning algorithms. The functioning of machine learning on the information can be understood without a row of code. It is perfect for machine learning data scientists who are beginners.
10. Jupyter
Project Jupyter is an IPython-based open source instrument that helps developers to develop open-source software and interactive computing experiences. Multiple languages such as Julia, Python, and R are supported. It is an instrument for composing live codes, visualizations, and lectures on the web application. Jupyter is a common tool intended to meet data science demands. It is an interactive environment where data scientists can fulfill their tasks. It is also a strong storytelling tool as it contains several presentation characteristics. You can clean, statistically compute, view and generate predictive machine learning models using Jupyter Notebooks. It is 100% open source and thus free of charge. There’s a collaboratory called Jupyter environment online that runs and shops Google Drive information on the cloud.
11. Tableau
Tableau is an interactive visualization software packaged with strong graphics. The company focuses on the business intelligence sectors. Tableau’s most significant element is its capacity to interface with databases, tablets, OLAP cubes, etc. Tableau can also visualize geographic data and draw the lengths and latitudes of maps together with these characteristics. You can also use its analytics tool to evaluate the information together with visualizations. You can share your results on the internet platform with Tableau with an active community. While Tableau is company software, Tableau Public comes with a free version.
Features of Tableau:
- Tableau has a mobile device management.
- It provides document API.
- It provides JavaScript API.
- ETL refresh is one of the important features of Tableau.
12. Scikit-learn
Scikit-learn is a Python-based library for machine learning algorithms. A tool that is commonly used for assessment and data science is easy and straightforward to execute. The Machine Learning system supports a range of characteristics, including information pre-processing, clustering, regression dimensional decrease, classification, etc. Scikit-learn makes using complex machine learning algorithms simple and is, therefore, an optimal platform for studies that require fundamental machine learning in circumstances that require rapid prototyping.
Conclusion
We can conclude that information science needs a wide range of instruments. The data science instruments are used to analyze information, create esthetic and interactive visualizations and create strong prediction models using algorithms. So in this article, we have seen different tools used for Data Science analysis and their features. You can choose tools based on your requirements and the features of the tool.


