Updated March 13, 2023

Difference Between Datadog vs Prometheus
The following article provides an outline for Datadog vs Prometheus. Datadog and Prometheus are used to monitor the servers; both provide the same purpose. So first, we will see Datadog, if we want to monitor our cloud-scale application, then we should go for Datadog because it helps us to monitor our servers, database, services and tool for this it uses a SAAS based data analytic program, and it was originally found in the year 2010.
Datadog is written in GO language; previously, it was in Python, its backend is build up on so many technologies we will convert. On the other hand, we have Prometheus, which is basically used for alternating and monitoring it is a free software application; it also provides us with the facility to capture the real-time metrics by using the HTTP pull model. This project is also written in GO, and it was founded in the year 2012; Prometheus consists of multiple tools that help us monitor.
Head to Head Comparison Between Datadog vs Prometheus (Infographics)
Below are the top 9 differences between Datadog vs Prometheus:
Key Difference Between Datadog vs Prometheus
Let us discuss some of the major key differences between Datadog vs Prometheus:
As we already know, both are used as the monitoring tool, but here one thing should be in focus that Datadog is a performance monitoring tool that focuses and gives all the details about the infrastructure; on the other hand, Prometheus is used as a Monitoring tool.
Here we will see some of the key differences between both of them, which make them unique.
1. Pricing: Datadog is free; it has some statics and monitors the specific number of customers for each server. For one server it offers 200 custom metric, which is being monitored by the datadog.
Take an example for a simple scenario:
Suppose we have one application which is running one of the 5 different servers; then for the 1000 custom metrics, it is free with a data log, but after this, we have to pay some change it is, 100 custom metric charges 5.00 USD. On the other hand, we have Prometheus, which is free; all this we can do is free for, but the total cost may be very high for this check on the Prometheus official website; they have given all the pricing there.
It uses some of the components or tools we can say, which are listed as below:
- PromQl: Prometheus allows us to own query language that users can use to aggregate their data and see. It basically stands for Prometheus query language.
- Data collection: This is a data collection that collects the data in time series, which is stored in the database.
- Data storage format: Now we have storage format Prometheus stores the data in the form of a metric.
2. Usage: If we talk about both, we have multiple cases to use them based on the requirement.
For Datadog:
- If you want to monitored your infrastructure logs, then go for Datadog.
- If you need alerting for the events.
- If you want or need to communicate with the team through the dashboard itself.
- If you want to gather the data from a different source and represent a single visual.
For Prometheus:
- If you want the alert for all the different data sources.
- If you want to use the tag for data metrics.
- Want time-series monitoring then go for Prometheus.
3. Find: Below for reference, we have both the link where we can have all the necessary information about them.
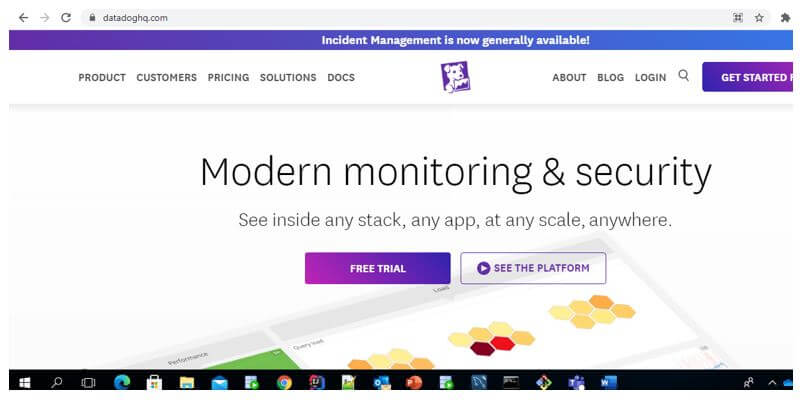
For Datadog, go on this link:
URL: https://www.datadoghq.com/
Output:
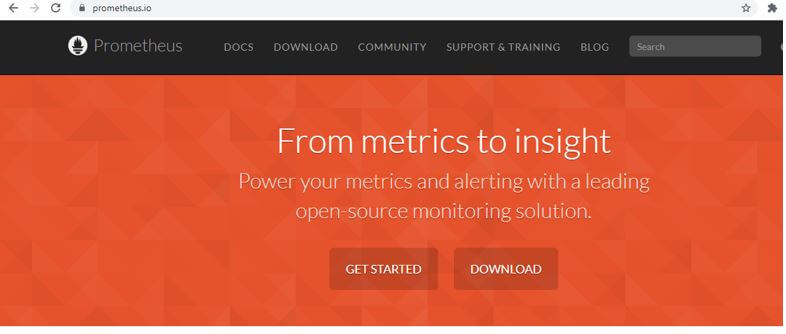
For Prometheus, go on below:
Output:
Datadog vs Prometheus Comparison Table
Let’s discuss the top 9 comparisons between Datadog vs Prometheus:
| Datadog | Prometheus |
| Datadog was found in the year 2010, and its backend is written in so many free and open source technologies like Kafka, PostgreSQL, Cassandra etc. | On the other hand, we have Prometheus, which was found in the year 2012, and written in the Go language. |
| Datadog is proprietary. | Prometheus is open source. |
| We talk about data dog; it is an APM tool which means time series, logs and tracing tool. | On the other hand, Prometheus it is a monitoring time-series tool for Kubernetes. |
| It basically deals with the infrastructure, which helps us to get the logs, metrics etc. | Prometheus is built around the time series database, which is able to fetch the data and store it inside. |
| It uses one dashboard to show all the metrics on it, and this dashboard uses a different graph to show the logs. | It also provides support for graphs, query and alerting, which is built-in. |
| One advantage of data dog is that it can integrate with so many different app and services. Also, it is able to communicate with any environment such as web browsers, cloud service mobile and containers. | To track and trace the metric, it uses HTTP to connect to the target endpoint. |
| It provides us with a deep trace of any app or stack because it is mainly focused on this. | It has Prometheus query language, which can be used to draw simple graphs and metrics. |
| By the use of it, we can bind the data from various sources and able to bind it inside the single visual on the dashboard. | On the other hand, Prometheus uses a multi-dimensional data model, which helps us to define the metric by some unique name, or we can use tags as well. |
| In short, it is a performance monitoring tool. | On the other hand, Prometheus is a monitoring tool. |
Conclusion
From the above some points, we have come to know that both are monitoring tools but used for a different purposes. They are easy to use and handle; by this, we can have event monitoring and alerting, time series logs and metrics and etc. We can identify our requirements and go with either two of them, which suits the most and fits best.
Recommended Articles
This is a guide to Datadog vs Prometheus. Here we discuss key differences with infographics and comparison tables, respectively. You may also have a look at the following articles to learn more –


