Updated May 23, 2023
Definition of Days in Inventory
The term “days in inventory” refers to the average number of days in a year that a company holds its stock inventory before it sells them in the market to generate revenue. In other words, it indicates the number of days that the current stock of the company is likely to last. It is also known as “inventory days of supply”, “days inventory outstanding”, and “the inventory period”.
Formula
The formula for this can be simply computed by dividing the average inventory held during the period by the company’s cost of sales during the same period, and then the result is multiplied by the number of days in the period (365 days in a year). Mathematically, it is represented as,
The average inventory is the mean of the inventory at the beginning of the year (a.k.a. opening inventory) and at the end of the year (a.k.a. closing inventory). The cost of sales (a.k.a. cost of goods sold) is the aggregate of all the costs that can be directly allocated to the manufacturing process. Examples of the cost of sales primarily include the cost of raw materials cost direct labor costs.
Average Inventory = (Opening Inventory + Closing Inventory) / 2
Cost of Goods Sold = Cost of Raw Material + Direct Labor Cost
Examples of Days in Inventory (With Excel Template)
Let’s take an example to understand the calculation in a better manner.
Example – #1
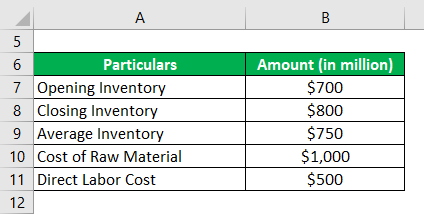
Let us take the example of a company that is engaged in the business of manufacturing leather products. The production manager of the company wants to calculate the inventory holding in terms of days. Help the production manager in calculating the inventory with the following information is available:
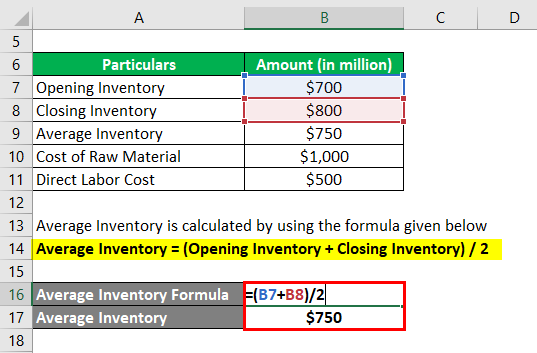
The formula used to calculate the average inventory is as follows:
Average Inventory = (Opening Inventory + Closing Inventory) / 2
- Average Inventory = ($700 million + $800 million) / 2
- Average Inventory = $750 million
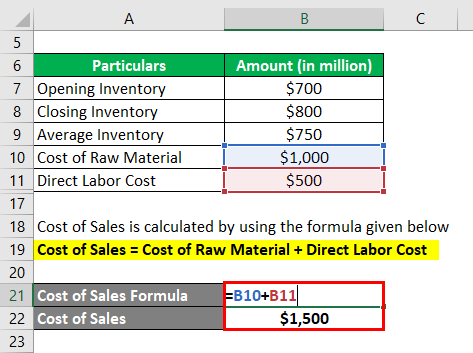
The formula used to calculate the Cost of sales is as follows:
Cost of Sales = Cost of Raw Material + Direct Labor Cost
- Cost of Sales = $1,000 million + $500 million
- Cost of Sales = $1,500 million
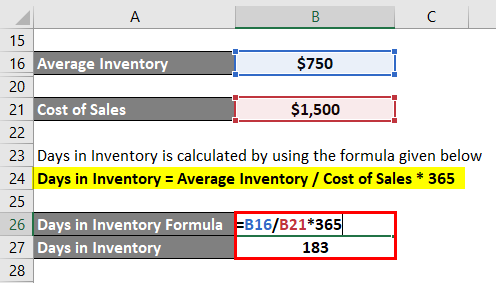
The formula used for the calculation is as follows:
Days in Inventory = Average Inventory / Cost of Sales * 365
- Days in Inventory = $750 million / $1,500 million * 365
- = 183 days
Therefore, the days in the inventory of the manufacturing company stood at 183 days.
Example – #2
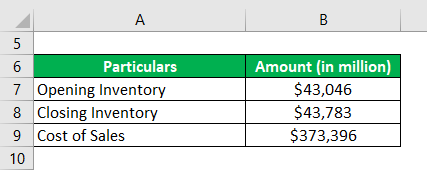
Now, we will take the example of Walmart Inc.’s latest annual report (FY18). As per the annual report, the company incurred a cost of sales of $373,396 million for the year, while the opening and closing inventory of the period stood at $43,046 million and $43,783 million respectively. Calculate the inventory days for Walmart based on the given information.
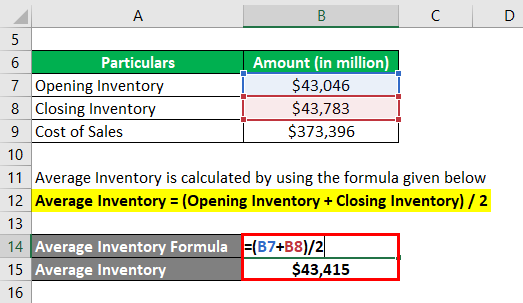
The formula used to calculate the average inventory is as follows:
Average Inventory = (Opening Inventory + Closing Inventory) / 2
- Average Inventory = ($43,046 million + $43,783 million) / 2
- Average Inventory = $43,415 million
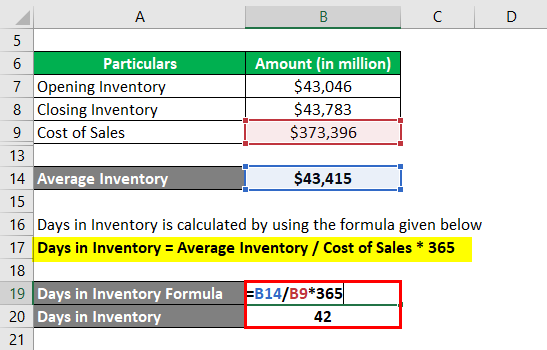
The formula used for the calculation is as follows:
Days in Inventory = Average Inventory / Cost of Sales * 365
- = $43,414.5 million / $373,396 million * 365
- = 42 days
Therefore, Walmart’s inventory for the year 2018 stood at 42 days.
Source: Walmart Annual Reports (Investor Relations)
Example – #3
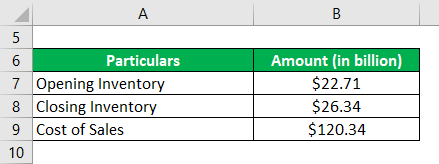
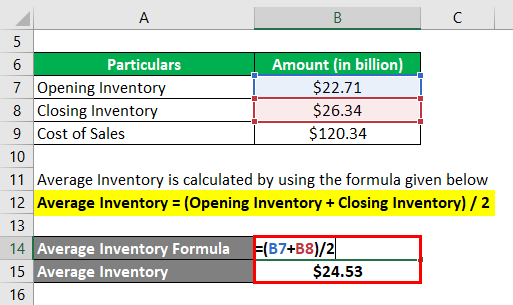
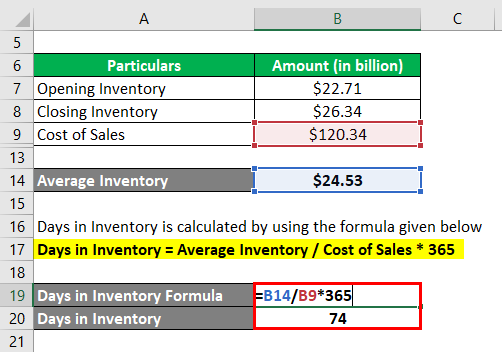
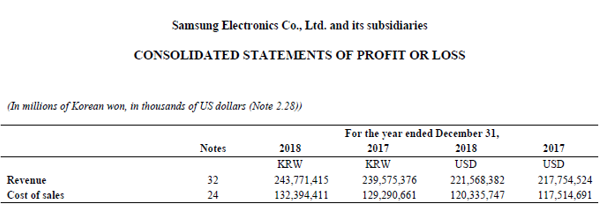
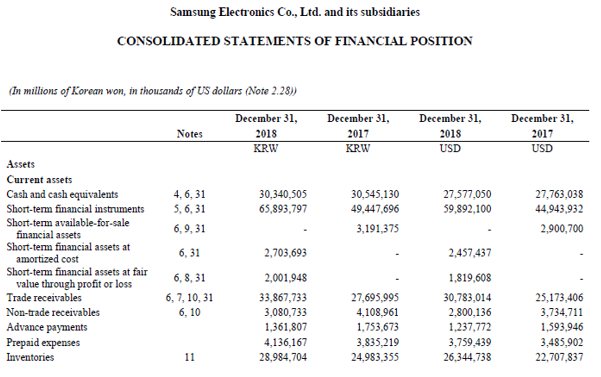
Let us take the example of Samsung’s annual report for the year 2018. According to the annual report, the cost of sales for the year was $120.34 billion, the opening and closing inventory of the period stood at $22.71 billion and $26.34 billion, respectively. Calculate the inventory days for Samsung for the year 2018 based on the given information.
The formula used to calculate the average inventory is as follows:
Average Inventory = (Opening Inventory + Closing Inventory) / 2
- Average Inventory = ($22.71 billion + $26.34 billion) / 2
- Average Inventory = $24.53 billion
= Average Inventory / Cost of Sales * 365
= $24.53 billion / $120.34 billion * 365
= 74 days
Therefore, Samsung’s day in inventory for the year 2018 stood at 74 days.
source: Samsung Electronics statement
Limitations
- It is easy to manipulate the value of inventory holding at the start and at the end of the year as they are balance sheet date figures.
- The ratio in itself is less than useful if seen in isolation. It must be compared to its industry peers to draw any meaningful insights.
Conclusion
So, it is another ratio that measures the ability of a company to convert its inventory holding into sales. It is an important concept to understand because it is an indispensable component of the working capital assessment. However, it should be remembered that this metric is only useful when compared to companies in the same industry.
Recommended Articles
This is a guide to the Days in Inventory formula. Here we discuss how it can be calculated using a formula and a downloadable Excel template. You can also go through our other suggested articles to learn more –
