Updated October 3, 2023
Decile Formula (Table of Contents)
What is a Decile Formula?
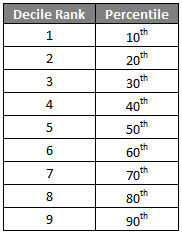
Decile is a statistical term that divides the data into ten defined intervals. It basically divides the data points into a data set in 10 equal parts on the number line.
This type of data ranking is used in many fields like finance and economics etc. One thing to bear in mind is that data points can be random, so we must first line up those numbers in ascending order on the number line before dividing them into deciles. Once we divide the data, decile ranking can be given:
Like other tools, quartile, and percentile, decile is also a method that divides data into smaller parts that are easier to measure, analyze and understand.
Formula For Decile:
Let’s say that we have a data set with N data points:
X – {X1, X2, X3……….. XN}
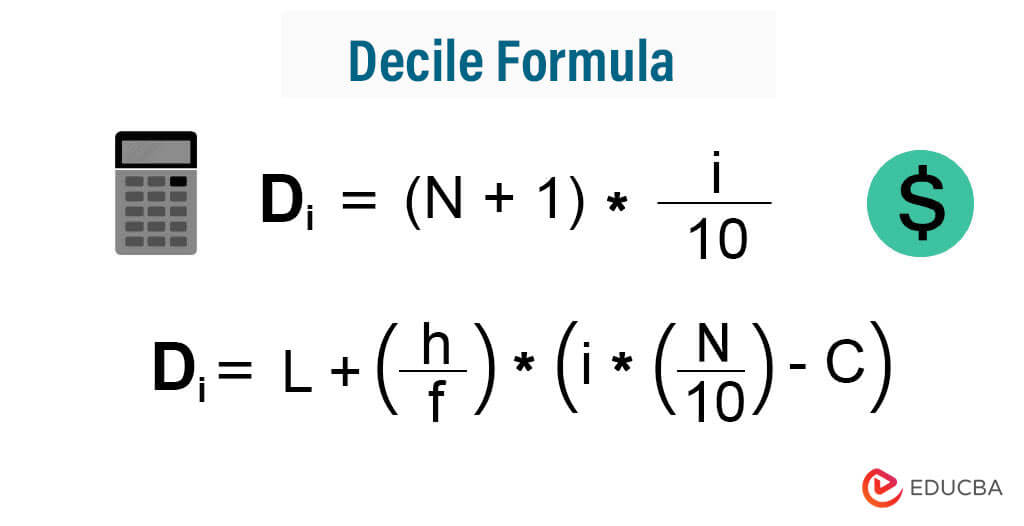
The formula for Deciles is given by:
D1 = (N+1) * 1 / 10
D2 = (N+1) * 2 / 10
And so on till
D9 = (N+1) * 9 / 10
From the above formula, we can see D5 = (N+1) * 5 /10 = (N+1)/2, which is the median. So 5th decile represents the median.
For grouped data:
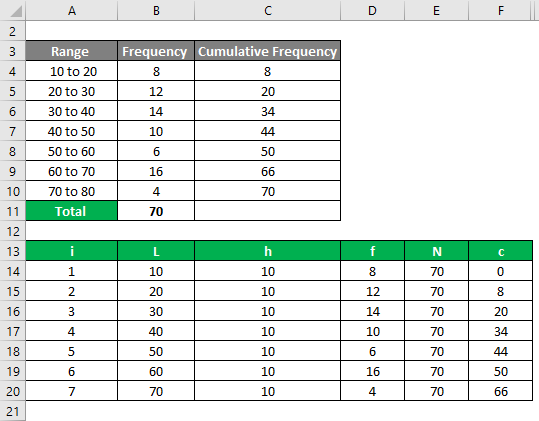
Where:
i = 1, 2, 3, 4, 5…, 9
- L – Lower boundary of a group
- h – Width
- f – frequency
- N – Total number of data points
- C – Cumulative frequency preceding to that class
Examples of Decile Formula (With Excel Template)
Let’s take an example to understand the calculation of Decile in a better manner.
Decile Formula – Example #1
Let’s say we have a data set which contains 39 data points. Calculate the Deciles.
Data Set:
Solution:
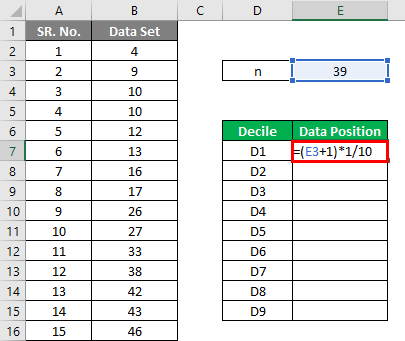
First of all, we have to arrange this in ascending order, i.e., from lowest to highest.
The decile is calculated using the formula given below
Di = (N + 1) * i / 10
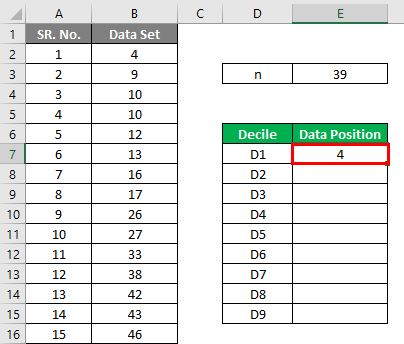
The result will be as given below.
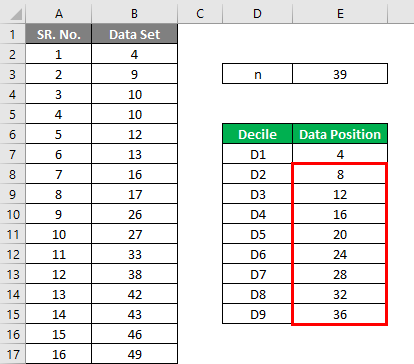
Similarly, calculate all the points.
Now
- D1 = (39 + 1) * 1 / 10 = 40 / 10 = 4th data point = 10
- D2 = (39 + 1) * 2 / 10 = 80 / 10 = 8th data point = 17
- D3 = (39 + 1) * 3 / 10 = 120 / 10 = 12th data point = 38
- D4 = (39 + 1) * 4 / 10 = 160 / 10 = 16th data point = 49
- D5 = (39 + 1) * 5 / 10 = 200 / 10 = 20th data point = 58
- D6 = (39 + 1) * 6 / 10 = 240 / 10 = 24th data point = 64
- D7 = (39 + 1) * 7 / 10 = 280 / 10 = 28th data point = 73
- D8 = (39 + 1) * 8 / 10 = 320 / 10 = 32th data point = 84
- D9 = (39 + 1) * 9 / 10 = 360 / 10 = 36th data point = 91
If you see the data set, the median of this set is (n + 1)/2 = 40 / 2 = 20th value, i.e. 58, the same as D5.
Decile Formula – Example #2
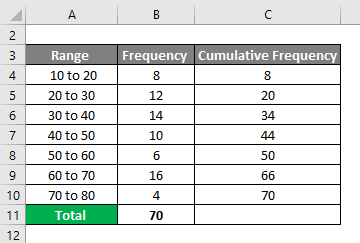
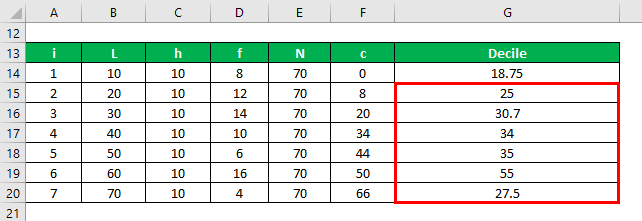
Consider the frequency table shown below, for which you need to calculate the deciles.
From the above image, we have given the following information.
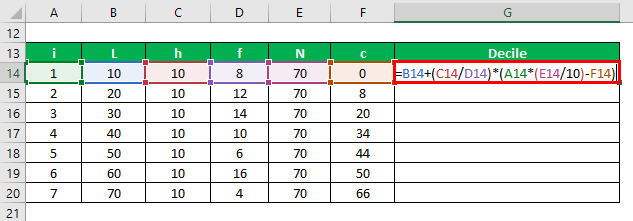
Decile is calculated using the given formula:
Di = L + (h / f) * (I * (N / 10) – C)
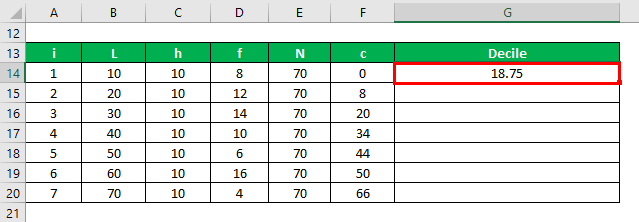
The result will be as given below:
Similarly, calculate for other values.
Di = L + (h / f) * (i * (N / 10) – C)
- D1 = 10 + (10 / 8) * (1 * (70 / 10) – 0) = 18.75
- D2 = 20 + (10 / 12) * (2 * (70 / 10) – 8) = 25
- D3 = 30 + (10 / 14) * (3 * (70 / 10) – 20) = 30.7
- D4 = 40 + (10 / 10) * (4 * (70 / 10) – 34) = 34
- D5 = 50 + (10 / 6) * (5 * (70 / 10) – 44) = 35
- D6 = 60 + (10 / 16) * (6 * (70 / 10) – 50) = 55
- D7 = 70 + (10 / 4) * (7 * (70 / 10) – 66) = 27.5
Explanation
We know that quartiles divide data into four equal groups, and a decile divides data into ten equal parts. Decile gives ranks to a data set from lowest to highest. This is done on a scale of 1 to 10, where each number basically indicates an increase of 10 percentage points. So, 1st decile has 10% of the data points below it, D2 has 20% of the data points below it, and so on. So, decile ranking is another method to categorize data like quartile or percentile.
Relevance and Uses of Decile Formula
As discussed above, Decile helps us quickly divide the data into ten parts. It eventually makes it easy to understand the data in these parts. In finance, deciles are used to analyze the performance of different funds by ranking them and measuring the performance of one fund against similar funds. For example, you are an analyst and are evaluating a set of mutual funds. So, any fund that is ranked 6 on a decile scale means that it is in the top 60% of the funds. So basically, we can use deciles and can segregate these funds into best and worst-performing funds for a particular period.
Recommended Articles
This is a guide to the Decile Formula. Here, we discuss how to calculate Deciles along with practical examples and a downloadable Excel template. You may also look at the following articles to learn more –
