Updated July 26, 2023
Definition of Defensive Interval Ratio?
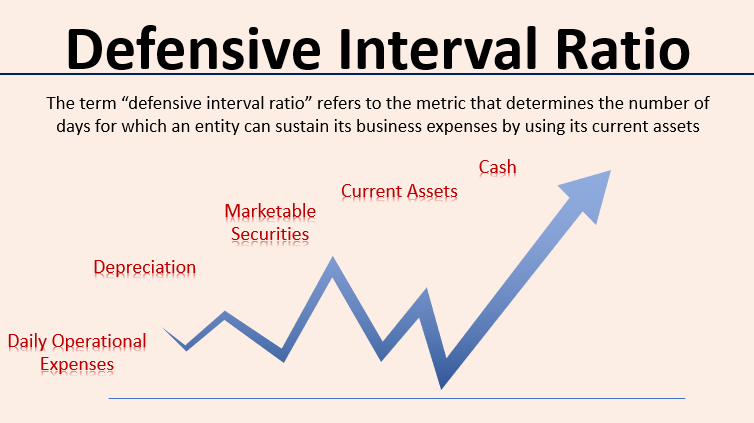
The term “defensive interval ratio” refers to the metric that determines the number of days for which an entity can sustain its business expenses by using its current assets.
In other words, the ratio evaluates the capacity of a business to operate without needing to use its non-current assets. It is also known as the “Defensive Interval Period”. The name “defensive” comes from the fact that to cover the expenses, the ratio uses current assets, considered defensive assets, because they are the most liquid form of assets and can be readily converted to cash.
Many analysts and investors find the metric of defensive interval ratio more useful than other financial efficiencies ratios like the current ratio or quick ratio because it is calculated by comparing the current assets to business expenses rather than the current assets to the current liabilities.
Formula
To derive the formula for the defensive interval ratio, divide the total current assets of the subject company by its daily operational expenses. Mathematically, it is represented as,
The current assets include cash, marketable securities, accounts receivables, prepaid expenses, etc. In contrast, daily operational expenses can be calculated by deducting non-cash expenses from the annual expenses and dividing the result by 365.
Examples (With Excel Template)
Let’s take an example to understand the calculation of the Defensive Interval in a better manner.
Example – #1
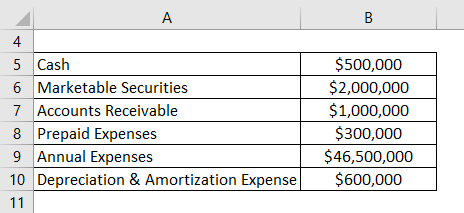
Let us take the example of John, who invested in ADF Ltd three years ago. Now John wants to evaluate the company’s liquidity position, and one of his friends suggested he use a defensive interval ratio. According to the latest annual report of ADF Ltd, the financial information is available. Based on the above-given information, help John calculate the defensive interval ratio for ADF Ltd.
Solution:
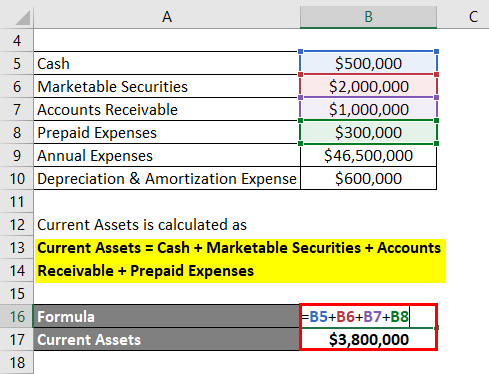
Let’s calculate Current Assets:
Current Assets = Cash + Marketable Securities + Accounts Receivable + Prepaid Expenses
- Current Assets = $500,000 + $2,000,000 + $1,000,000 + $300,000
- Current Assets = $3,800,000
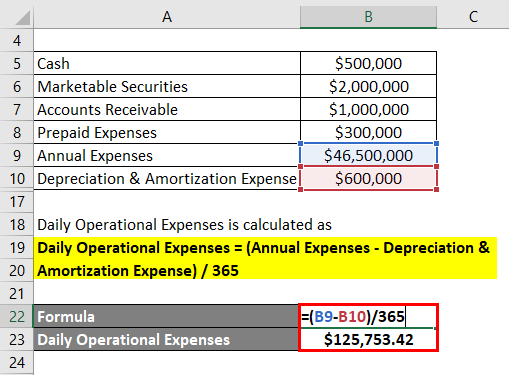
Let’s calculate Daily Operational Expenses:
Daily Operational Expenses = (Annual Expenses – Depreciation & Amortization Expense) / 365
- Daily Operational Expenses = ($46,500,000 – $600,000) / 365
- Daily Operational Expenses = $125,753.42 per day
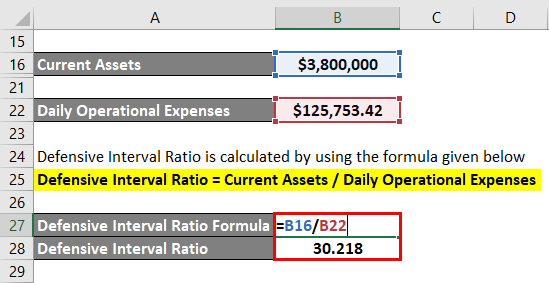
It is calculated by using the formula given below
Defensive Interval Ratio = Current Assets / Daily Operational Expenses
- DIR = $3,800,000 / $125,753.42 per day
- DIR = 30.218 days
Therefore, the defensive interval ratio of ADF Ltd stood at 30 days during the last financial year, indicating that the company’s current assets can support its operating expenses for 30 days.
Example – #2
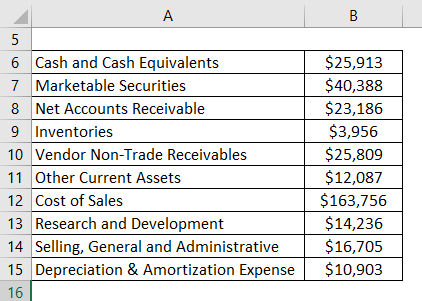
Let us take the example of Apple Inc. to understand the concept of the defensive interval ratio in the case of a real-life company. According to the annual report for the year ended on September 29, 2018, the financial information for 2018 is available. Calculate the defensive interval ratio for Apple Inc. for the year 2018.
Solution:
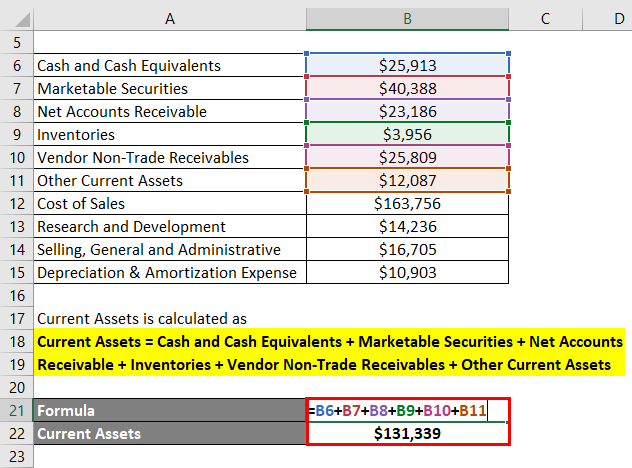
Let’s calculate the current assets
Current Assets = Cash and Cash Equivalents + Marketable Securities + Net Accounts Receivable + Inventories + Vendor Non-Trade Receivables + Other Current Assets
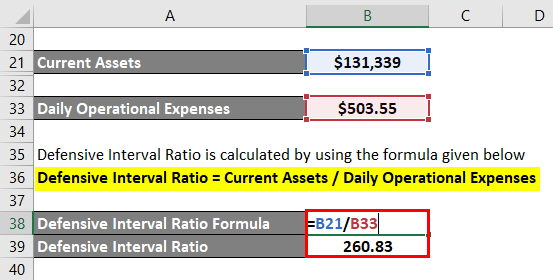
- Current Assets = $25,913 Mn + $40,388 Mn + $23,186 Mn + $3,956 Mn + $25,809 Mn + $12,087 Mn
- Current Assets = $131,339 Mn
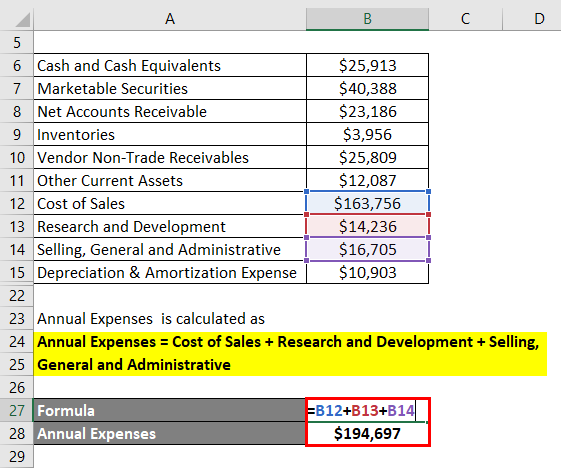
Let’s calculate the Annual Expenses:
Annual Expenses = Cost of Sales + Research and Development + Selling, General and Administrative
- Annual Expenses = $163,756 Mn + $14,236 Mn + $16,705 Mn
- Annual Expenses = $194,697 Mn
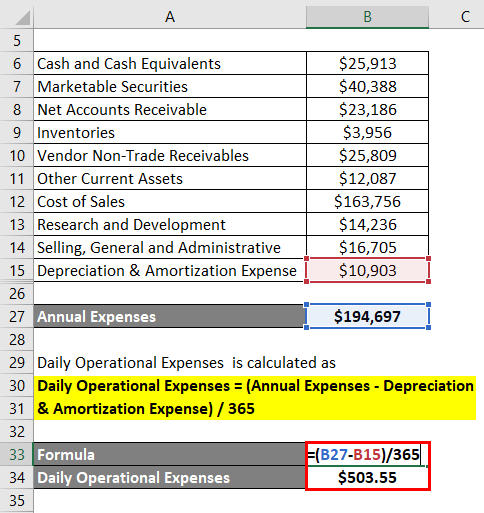
Let’s calculate Daily Operational Expenses:
Daily Operational Expenses = (Annual Expenses – Depreciation & Amortization Expense) / 365
- Daily Operational Expenses = ($194,697 Mn – $10,903 Mn) / 365
- Daily Operational Expenses = $503.55 Mn per day
Let’s calculate Defensive Interval Ratio:
Defensive Interval Ratio = Current Assets / Daily Operational Expenses
- DIR = $131,339 Mn / $503.55 Mn per day
- DIR= 260.83 days
Therefore, the defensive interval ratio of Apple Inc. stood at 261 days during 2018, which indicates a very comfortable liquidity position of the company.
Source: Apple’s Annual Report
Advantages and Disadvantages
Advantages
Some of the advantages of the DIR are:
- It assesses a company’s liquidity position from the perspective of covering the business operating expenses with readily convertible assets, which is not the case with other liquidity ratios like the current, quick, or cash ratios.
- It gives a clear estimate of the days a company can sustain its operating expense without liquidating its long-term assets in case of financial difficulty.
Disadvantages
Some of the disadvantages of DIR are:
- It is fairly difficult to decide whether the number of days is good or bad if not compared with other companies in the same industry.
- It does not consider that the current assets would not liquidate at their current value during distress.
Conclusion
Companies use a very useful ratio to assess their liquidity position. However, it should be compared with companies in the same industry to derive meaningful insight.
Recommended Articles
This has been a guide to the Defensive Interval Ratio. Here we discuss how the Ratio can be calculated with its formula, examples, and a downloadable Excel template. You can also go through our other suggested articles to learn more –
