Updated March 4, 2023

Introduction to Delta Function Matlab
In Matlab, for execution of Delta Function ‘dirac’ statement is used. The function has the value 0 for all Y ≠ 0, and ∞ for Y = 0 is known as Dirac delta function δ(Y). The Dirac delta function acts element-wise on non-scalar inputs. ‘Dirac’ statement returns NaN if the input is complex values of Y with nonzero imaginary parts. One of the input argument must be scalar. If the other one is a vector or a matrix, then dirac statement expands the scalar into a vector or matrix of the same size as per the other argument.
Syntax:
The syntax for Delta Function Matlab is as shown below:
d1 = dirac (Y)
d1 = dirac(n, Y)
Where n gives position of the input elements.
How does Delta Function works in Matlab?
For a delta function plotting we use stem function because data is in the discrete form.
Given below are the steps for delta function plotting using stem statement:
Step 1: We take variables and assign input arguments.
Step 2: Then we use ‘dirac’ statement and we can find the delta values δ(Y) of input arguments.
Step 3: Then we use a stem statement with appropriate syntax to plot the delta function.
Examples of Delta Function Matlab
Given below are the examples mentioned :
Example #1
Let us see an example, in this example we take a nth derivative using a dirac function, dirac is a dirac delta function. Where n is order of derivative. So the dirac (n1, x1) is used to take a nth derivative of delta function as x1. Then we use a syms function, syms is a used to create symbolic variables and functions, we take syms x1. Now we take order of derivative and it stored in n1, and the n1 is vectors so we take a value are 0, 1, 2, 4, and 5. Now we use a dirac function, we take direc (n1, x1), it will expand the scalar into the vector using dirac function as the same size of n1 and compute the result and that result stored in d1 variable. One of the input arguments must be a scalar, or Y and n must be vectors or matrices of the same size. One of the input arguments is be scalar and the other one is a vector or a matrix, then dirac statement expands the scalar into a vector or matrix of the same size as per the other argument. Then we substitute the value of x is 0, for the substitution we use a subs function, subs(d1, x1, 0) returns a copy of d1, replacing all occurrences of x1 with 0, and then evaluates d1. Then it displays the result in the form of infinity and –infinity.
Code:
clc;

clear all;

close all;

syms x1

n2 = [0,1,2,4, 5, 6, 7, 8, ];d1 = dirac(n2,x1)subs(d1,x1,0)
Output:
As we saw the d1 values are in the form of vector and then we substitute the x1 with 0 and the result is in infinity or –infinity.
Example #2
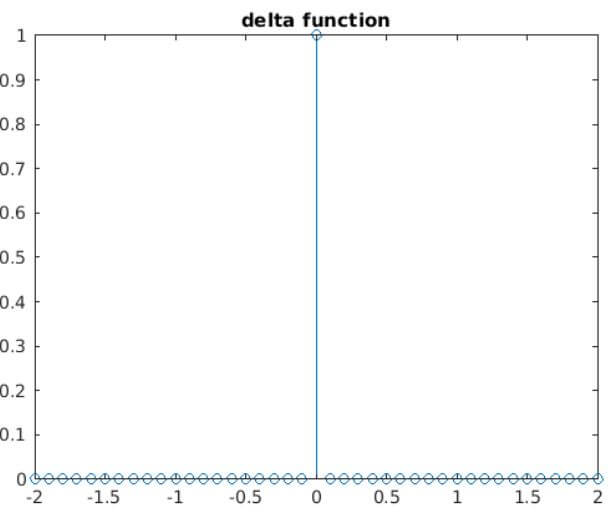
In this example we plot a delta function using a dirac function, basically we use a dirac (n, x1) this syntax is used for represent the nth derivative of delta function as x1. Where n is order of derivative. In example first we take a range for x axis the range is from -2 to 2 whit a difference of 0.1 this range we take in a variable x1, x1 variable is corresponds to x-axis. Then we use a dirac function, direc is a direc delta function. So we take a dirac of x1 and stored in y1 variable. Then we find an infinite value among the all values which are stored in y1 variable, for finding a infinite we use == operator it is used for equality operation for that we use y1 == Inf it is find the infinite value among all of that values and that infinite index value stored in idx1 variable. We cannot see infinite magnitude or value in matlab plot so we assign a 1 to that infinity value for that we write y1 (idx1) = 1 this statement. So we now change the value to 1 of that infinity magnitude using that number index. Then lastly we plot a signal using a stem function, stem is used to plot a discrete signals. We take stem in parenthesis that two variables x1 and y1. At the end we assign a title to that plot using a title function.
Code:
clc;

clear all;

close all;

x1 = -2:0.1:2;y1 = dirac(x1);idx1 = y1 == Inf;y1(idx1) = 1; stem(x1,y1)

title ('delta function') ;
Output:
As we saw a plot we can notice that only at 0 position signal is present and all other there no signal present.
Conclusion
In this article we saw the concept of delta function, basically dirac (Y) statement represents the Dirac delta function. Then we saw syntax related to delta function in matlab and how does it works in matlab code. Also we saw some examples related to delta function.
Recommended Articles
This is a guide to Delta Function Matlab. Here we discuss the introduction to Delta Function Matlab, how does it works with respective examples. You may also have a look at the following articles to learn more –


