Updated July 17, 2023

Definition of Downside Risk
Downside risk, as the terms suggest, refers to the risk associated with the stock such that the stock price may have a downward movement resulting in a financial loss.
In other words, downside risk is the possibility of losing money or value on account of any changes in the market and eventually a downward change in the stock price.
Explanation
While discussing downside risk, you may understand that the term “Risk” is basically a measure of either upward or downward standard deviation. It measures standard deviation for only those stocks where the return is/are below average or expected.
The main difference is that standard deviation assumes that returns are symmetrical. That is, the risk of a stock movement will be similar either in upward or downward movement. Downward risk is asymmetrical, considering the risk associated with the stock price movement varies when it moves upward or downward.
In this article, we will deal with understanding the downside risk, what it means, how to calculate it, and the measures of downside risk.
Formula
Downside risk can be calculated easily by way of a mathematical formula as follows:
As you can see, it can be calculated in simply a few steps.
- Find out the deviation in returns
- Segregate negative returns
- Square negative returns
- Sum the square of numbers so derived and divide by no. of periods
- Find the square root of the number arrived in the step above.
Example
Let’s understand the downside risk with the help of an example. Suppose there is a company called Exumor Chanels Inc., with returns of the past 15 years given in the table below. For the purpose of this example, let’s take the expected return to be 6%.
| Year | Return % |
| 1995 | 8% |
| 1996 | 6% |
| 1997 | -7% |
| 1998 | -5% |
| 1999 | 3% |
| 2000 | 5% |
| 2011 | 4% |
| 2012 | 9% |
| 2013 | -2% |
| 2014 | -12% |
| 2015 | 3% |
| 2016 | 9% |
| 2017 | 15% |
| 2018 | 12% |
| 2019 | 7% |
Now, using the most commonly used method of semi-variance to calculate the downside risk, we will compute the downside risk for investing in Exumor Chanels Inc.
- Step 1: Calculate the deviation of the actual return from the expected return.
| Year | Return % | Expected return | Deviation |
| 1995 | 8% | 6% | 2% |
| 1996 | 6% | 6% | 0% |
| 1997 | -7% | 6% | -13% |
| 1998 | -5% | 6% | -11% |
| 1999 | 3% | 6% | -3% |
| 2000 | 5% | 6% | -1% |
| 2011 | 4% | 6% | -2% |
| 2012 | 9% | 6% | 3% |
| 2013 | -2% | 6% | -8% |
| 2014 | -12% | 6% | -18% |
| 2015 | 3% | 6% | -3% |
| 2016 | 9% | 6% | 3% |
| 2017 | 15% | 6% | 9% |
| 2018 | 12% | 6% | 6% |
| 2019 | 7% | 6% | 1% |
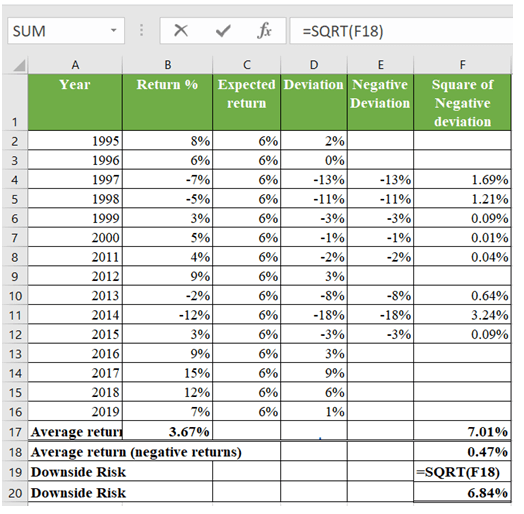
- Step 2: Now, segregate the ones with negative returns, and simply square them up and calculate the average return (sum of total return ÷ No. of years).
| Year | Return % | Expected return | Deviation | Negative Deviation | Sq. of Negative deviation |
| 1995 | 8% | 6% | 2% | ||
| 1996 | 6% | 6% | 0% | ||
| 1997 | -7% | 6% | -13% | -13% | 1.69% |
| 1998 | -5% | 6% | -11% | -11% | 1.21% |
| 1999 | 3% | 6% | -3% | -3% | 0.09% |
| 2000 | 5% | 6% | -1% | -1% | 0.01% |
| 2011 | 4% | 6% | -2% | -2% | 0.04% |
| 2012 | 9% | 6% | 3% | ||
| 2013 | -2% | 6% | -8% | -8% | 0.64% |
| 2014 | -12% | 6% | -18% | -18% | 3.24% |
| 2015 | 3% | 6% | -3% | -3% | 0.09% |
| 2016 | 9% | 6% | 3% | ||
| 2017 | 15% | 6% | 9% | ||
| 2018 | 12% | 6% | 6% | ||
| 2019 | 7% | 6% | 1% | ||
| Average return | 3.67% | 7.01% |
- Step 3: Finally, you find the square root of the number, so you arrive to determine the downside risk.
Measures of Downside Risk
- So now that you have understood what downside risk is, it is clear that every investor will have their own set of risk qualities, investment strategies, and unique portfolios.
- As a widely accepted method, Value-At-Risk and Semivariance are used to calculate the downside risk.
- Value-At-Risk means the loss of investments the investor will have to bear, basis a given probability, market condition, and timeframe.
- Semi-variance is the square root of semi-deviation. A detailed understanding can be taken from the example discussed above.
Downside Risk Graph
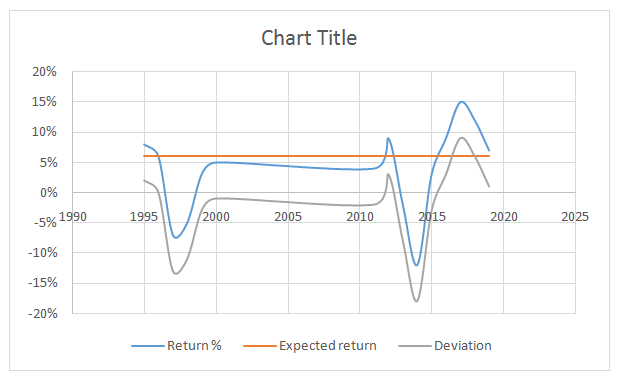
Continuing with the above example, below, you can see a graphical representation of the deviation of returns over the years compared to the expected rate of return. The orange line shows the investor’s expected return, whereas the blue line shows the positive returns of the security over the years. Note that the grey line in the graph, wherever seen below the X-axis, depicts the negative deviation.
Management of Downside Risk
With unique strategies and investments, every investor may consider the following parameters to manage his stock or portfolio.
- Timeframe: How long is the investor planning to hold the security and accordingly strategize?
- Market Volatility: The market is very volatile, and the returns on the security may be equally varied. Thus, as an investor, you must be prepared for sudden changes in returns.
- Risk Appetite: The investor’s risk appetite will decide on drafting a proper strategy to plan for downside volatility in security.
- Safety: As an investor, you would like to minimize the downside risk to ensure the safety of your principal amount
- Expensive: Strategy planning may be costly as you need to deploy funds to protect against downside risk.
Advantages
Some of the advantages are given below:
- It is a preventive measure for investors to safeguard them against unexpected losses.
- This can be applied across assets such as equity, debt and derivatives like futures and options.
- It keeps the investor prepared for the maximum loss scenario.
- It helps the investors plan hedging trades to hedge against the expected loss.
Disadvantages
Some of the disadvantages are given below:
- All calculation for downward risk is based on historical data. It assumes that the gain/loss trend will continue similarly.
- Based on assumptions and thus, results can vary according to the assumption considered.
- There is a standard to follow on an acceptable level, as each investor shall have a different risk appetite.
- Experienced investors and traders will be better positioned to carry out hedging opportunities.
Conclusion
The downside deviation measures calculating the risk of all the negative side returns of the expected or average return. Various investors measure the upside and downside deviation separately. And based on their preferences, they use the downside risk to know the scenario in the event that there is a financial loss in the investments and the extent to which they can lose.
Remember, downward risk only gives a worst-case scenario, and it is not that every expected investment will go downwards…!!!
Recommended Articles
This is a guide to Downside Risk. Here we also discuss the definition and option pricing for at the money, advantages, and disadvantages. You may also have a look at the following articles to learn more –


