Introduction to Dynatrace Tools
The application monitoring tool that helps the users with proper performance monitoring and consistent availability in the system is called Dynatrace. The infrastructure is also monitored. If there are any performance issues, the tool checks the servers’ infrastructure and database and codes to know the underlying issue. It does multi-tasking by managing the applications’ performance, maintaining the artificial intelligence side of the operations, and monitoring the digital performance management of the system. This tool uses any applications where end to end transaction details are provided in the tool.
Top Dynatrace Tools
Below are the top dynatrace tools:
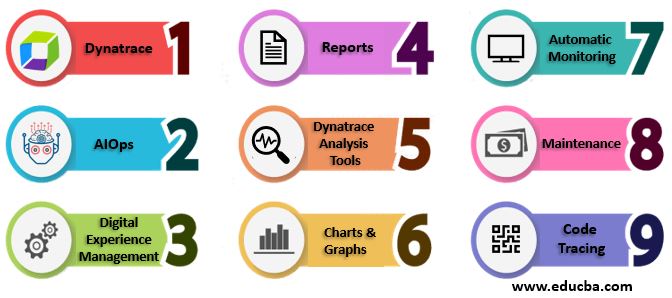
1. Dynatrace
This is managed with the help of the cloud in the SaaS platform. This monitoring tool, as explained, has all the logs and helps in monitoring by checking all the history of logs in the system. The troubleshooting is done to find the errors or bytecode information so that the applications that work with this tool is available always whenever needed. The data is fetched and shown in the cloud platform or the dashboard so that any updates can be known easily and the errors are traced. All the performance-related issues are provided in this tool with sufficient logs.
2. AIOps
Artificial Intelligence for Operations will help the user know the operations in and out and monitor data. AI knows when to pitch in during monitoring the data. This makes the data worth every penny used. Techniques and algorithms used are purely in AI format. In short, using AI in operations is like monitoring by humans for data is no longer needed, and AI takes good care of the data. This is an umbrella term and many operations and technology come under this item. All the complex items are taken care of and looked into while AI is used for operations.
3. Digital Experience Management
As the name suggests, this tool serves to know how the customer is being treated by any application and how the customer feels about it. The traditional method of surveying is not needed as DEM takes data from the site traffic, sales figures, and online surveys of less than a minute so that customer is not frustrated.
4. Dynatrace Analysis Tools
Different tools are available in Dynatrace, and it depends on the users to select the tool based on their needs. Filter helps to separate the monitoring data based on the request user has made. Also, naming patterns can be defined and filtered based on the rules made in the tool. Conditions have to be defined in the early stage, and these are accessible via Metrics of Dynatrace.
5. Charts & Graphs
The data got through the filters can be used to create charts and graphs so that proper visual analysis can be made. Multidimensional analysis can be done in the tool to compare and analyze the results of the requests loaded into the tool. Load tests can be monitored whenever needed with the charts seen in the user interface. Graphs are mostly used to compare the values of two different requests and make proper conclusions. This helps to understand the performance changes for which Dynatrace is mainly used. Response time and loading time comparisons help the user know the time duration taken for each activity and plan the loads in the tool accordingly. The diagnostic tool is also used in the tool so that any web requests can be used to analyze and filter the user’s loads.
6. Reports
Reports can be generated easily in the tool with the requests being generated and the logs created with each request. Diagnostics and performance of the tool with the graphs and charts can also be seen in the report being generated. The metrics API in the system generates the report. The problems and the solutions and details of the same can also be seen in the report. Problems usually occur during the load tests, and these can be figured out with the help of problem API.
7. Maintenance
It is good to run the maintenance window before running the testing and after loading the applications. With the heavy load, if the applications are with huge memory, there is a chance that the services or baselines may fail and negatively impact the running of the tool. In order to avoid this, the maintenance window is provided in the tool so that loads, response times, and any other issues are taken care of inside the tool itself. And if the tool is used to know the errors and the performance of the application along with the services, then the maintenance window is not used.
8. Automatic Monitoring
In the DevOps services of Dynatrace, containers and Kubernetes are used. These microservice workloads are monitored with the help of automatic monitoring. The containers’ performance and communication are noted, and if the performance is poor, it is noted down in the tool. Poorly performed containers are notified through logs and then through reports through which either they can be modified or replaced for performance improvement. The languages used in the applications, software architectures, cloud services, and enterprise applications are monitored automatically with the Dynatrace tool’s help.
9. Code Tracing
Same as automatic monitoring, code tracing is also automatic. All the codes written in the application is traced for bugs, and if they are working fine, they are not mentioned in the reports. But if they have any issues in the code, the user is notified about the same to change the working of the code. The performance can be optimized and analyzed so that user experience can be improved for Dynatrace usage.
Conclusion
The tool works excellent with all the applications and advantages listed. Sensors are used to monitor the usage, and the logs give a clear picture of the application with the reports being generated. Security is also offered in the tool so that outside applications are monitored well, and if they are harmful, users are notified.
Recommended Articles
This is a guide to the Dynatrace Tools. Here we discuss the Introduction and the top Dynatrace Tools like Dynatrace, AIOps, Digital Experience Management, Dynatrace Analysis Tools, etc. You may also have a look at the following articles to learn more –

