Updated August 25, 2023
What is Economic Equilibrium?
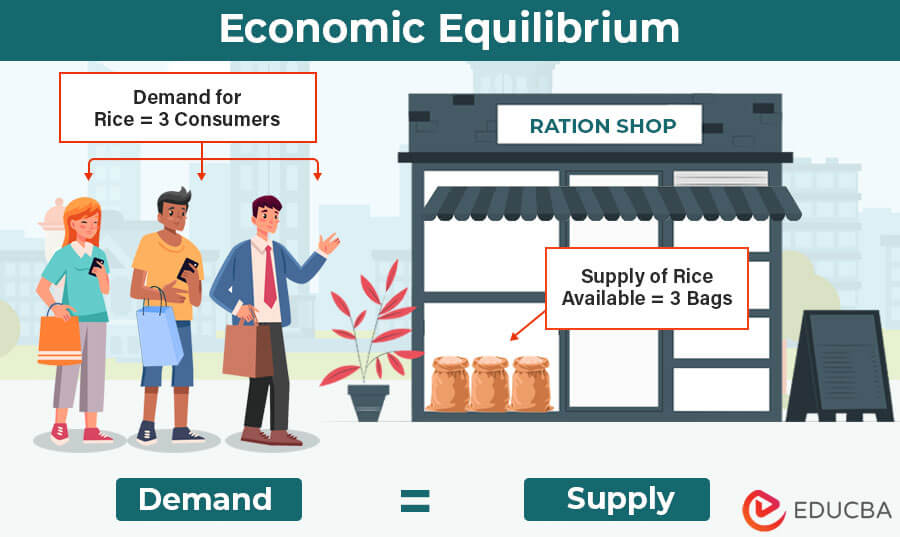
Economic equilibrium is a situation when both the product demand and supply in an economy are equal, resulting in a stable price for goods and services.
It means the amount of a product customers want to buy is the same as the amount of goods and services available. There is neither a shortage nor an excess of the product in the market. Understanding this can help individuals and businesses make informed decisions and ensure markets function efficiently. However, this is a theoretical concept because the market constantly changes in the real world and cannot achieve equilibrium.
Table of Contents
Key Highlights
- Economic equilibrium is only a theoretical concept where market variables, like the demand and supply of goods, are equal.
- It is of two types: Macroeconomics and Microeconomics. We can further classify them as static and dynamic.
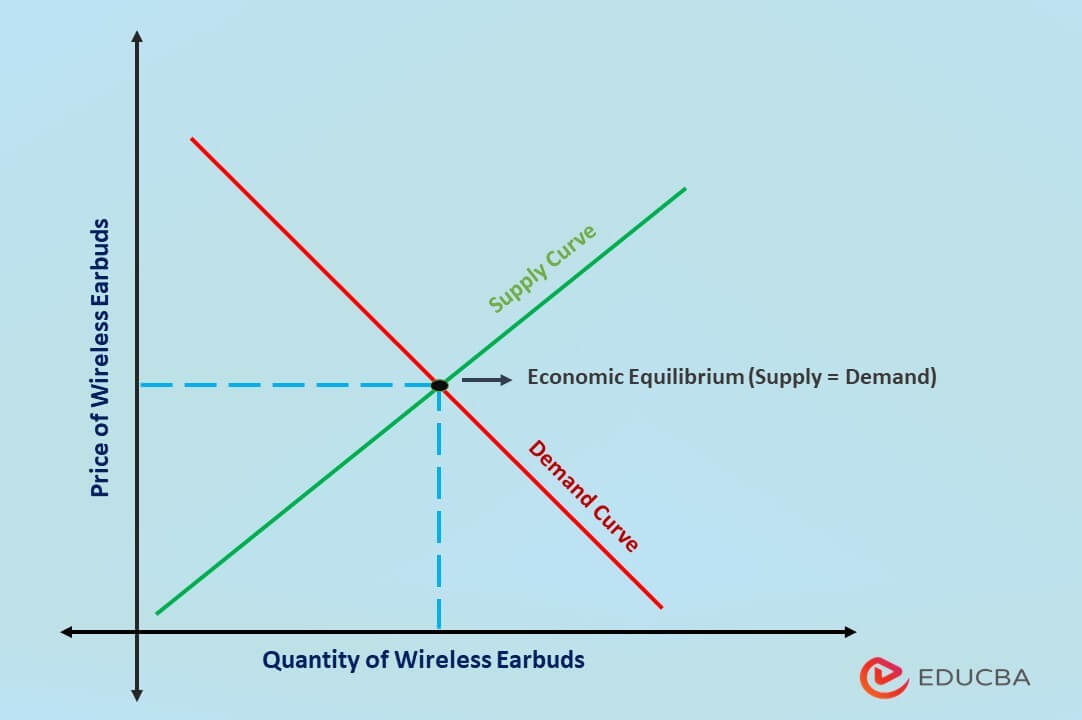
- The equilibrium graph explains how the supply and demand of an economy create an equilibrium in the market and how it affects the prices of the product.
Economic Equilibrium Explanation
- In a market-based economy, demand and supply determine the prices of goods and services.
- When demand and supply are equal, the price is stable, and this price is an indicator of equilibrium.
- However, when demand and supply change, it disrupts the equilibrium, leading to either an increase or a decrease in price.
- When demand increases, and the supply decreases, the price increases. This price increase can eventually reduce demand and restore equilibrium.
- Conversely, if demand decreases and the supply is higher, it results in a price drop. So, when consumers start buying cheaper products, the demand increases, returning it to equilibrium.
Examples of Economic Equilibrium
- Petroleum: Suppose that the Arab citizens consume 500 tons of petrol every year and the oil companies supply the exact same quantity of petrol. It is an economic equilibrium.
- Airline Tickets: Consider that during summers, US airlines have 250 available seats every day, and if exactly 250 individuals want to travel every day, then it will be an equilibrium
- Mobile phones: Imagine India imports 150,000 pieces of the newly launched iPhones, and an equal number of Indians want to purchase the phone. Then, this is an equilibrium.
- Housing: Let’s say China continuously builds new housing every year. With their constantly increasing population, the demand and supply for real estate will always be equal.
Types
We can categorize equilibrium based on two factors: Consumer-level and time.
Based on the Consumer Level
- Microeconomics: When the demand and supply are the same in individual markets and among individual consumers and producers, it is microeconomic equilibrium.
- Macroeconomics: When the aggregate demand and supply are equal globally or on a national level, it is macroeconomic equilibrium.
Based on Time
We can further divide the above-given types into the following.
- Static: It is when the demand for a good matches its supply volume for a particular period of time.
- Dynamic: It is when the demand and supply constantly change over a long period of time, but still, both are always equal.
Economic Equilibrium Graph
Let’s consider a simple market for a product, say wireless earbuds. In this market, we have two axes on the graph:
- X-Axis (Quantity): This represents the number of wireless earbuds producers are making and consumers are buying.
- Y-Axis (Price): This represents the prices at which the producers are selling the wireless earbuds as well as at the prices at which consumers are purchasing wireless earbuds.
Equilibrium:
Let’s say that, at the current moment, the market is in balance. It means that the quantity demanded by consumers equals the quantity supplied by producers at a specific price. This point is where the demand and supply curves intersect.
- Demand Curve (D): The demand curve represents the amount of products consumers are willing to buy. It is a downward slope because when the prices for an item decrease, as a result, its demand increases.
- Supply Curve (S): This curve represents the quantity of goods the producers and manufacturers produce in an economy. It is an upward slope because when the price for a product increases, businesses start producing more quantities of that product to increase their sales and profits.
The point of intersection between the demand and supply curves represents the equilibrium price (P*) and equilibrium quantity (Q*) of wireless earbuds.
Economic Equilibrium Formula
To create an equilibrium graph, we can use the equilibrium equations, which are as follows:
Quantity supplied (Qs) = x + yP
Quantity demanded (Qd) = x-yP
Where,
- x & y = coefficients
- P = Price
As we know, at equilibrium, the demand and supply are equal. Thus, Qs=Qd.
Now, let us see how we can use the above equations to find the equilibrium price and quantity.
Suppose we have the given equations:
Quantity supplied (Qs) =20+20P
Quantity demanded (Qd) =200-10P
Solution:
1. Equilibrium Price
At the equilibrium price, Quantity supplied (Qs)=Quantity demanded (Qd)
So,
20+20P = 200-10P
10P + 20P = 200 -20
30P = 180
P=180/30
P=$6
The equilibrium price will be $6.
2. Equilibrium Quantity
Let’s determine the quantity of supply and demand at this equilibrium price.
Now,
Quantity of supply:
Qs =20+20P
Qs =20+20(6) = 20 + 120 = 140
Quantity of demand:
Qd=100-10P
Qd =200-10(6)= 200 – 60 = 140
This means that the quantity of supply and demand is equal (140=140) at $6.
You can further use the equations to find the quantity supplied and demanded at different prices and accordingly plot the graph.
Frequently Asked Questions (FAQs)
Q1. Why is economic equilibrium important?
Answer: Economic equilibrium is essential for proper resource allocation, price stability, and to achieve market equilibrium. It prevents shortage and surplus of quantity and ensures that consumers get the products at reasonable prices. It also encourages businesses to produce new innovative products to gain a competitive edge in the market.
Q2. What are the factors that affect economic equilibrium?
Answer: Some of the factors affecting economic equilibrium are as follows.
- Excess or shortage of demand and supply
- Changes in Global economic conditions
- Interest rates, taxes, and subsidies affecting production cost
- Natural disasters, pandemics, or economic crises.
Recommended Articles
This is a comprehensive article on economic equilibrium. It includes a detailed explanation, its types, examples, and graphs. We have also discussed how to calculate the equilibrium price using an example. You can also refer to our other articles for more information.


