Introduction to Fibonacci Retracement
Fibonacci retracement helps traders find important price levels by using special ratios, making it easier to predict where the market might stop or change direction. If you are new to trading and looking to improve your skills, you may master it by taking the Fibonacci Retracement Course to gain deep trading knowledge. This definitive guide has all the answers you want about Fibonacci Retracement.
How Traders Use Fibonacci Retracement?
Here’s how Fibonacci retracement is used in trading:
- Identify potential reversal points in an uptrend or downtrend.
- Locate key levels, like 38.2%, 50%, and 61.8%, for potential support and resistance.
- Decide optimal points to enter or exit trades based on price reactions at Fibonacci levels.
- Combine fibonacci retracements with other indicators or patterns for confirmation.
- Use fibonacci levels to set risk management parameters and target profit levels.
- Apply fibonacci retracements across different timeframes for versatile analysis.
- Adapt strategy based on market trends, using retracements to join or exit trends.
How to Identify Support and Resistance Levels?
The fibonacci retracement course helps traders spot two key things – potential support and resistance zones.
1. Support levels
Support levels are where people are interested in buying enough to stop prices from falling. This is where downtrends might take a break or change direction. You can find these support levels at fibonacci ratios like 0.382, 0.500, and 0.618 using fibonacci retracement. When prices bounce off these levels, it confirms them as support.
2. Resistance levels
Resistance levels indicate where people are interested in selling enough to halt price rallies (when the price of an asset is going up). This is where uptrends might slow down or change direction. Fib ratios like 0.382, 0.500, and 0.618 can also act as resistance during pullbacks. If a price tries to go up to these levels and gets rejected, it signals the formation of potential resistance.
3. Using multiple timeframes
Drawing your Fib tool on multiple timeframes (1 min, 5 min, 1 hour, etc.) provides more confluence for true support/resistance levels. The more timeframes showing a level, the stronger it usually is. Identifying real S/R will improve your risk/reward ratio drastically.
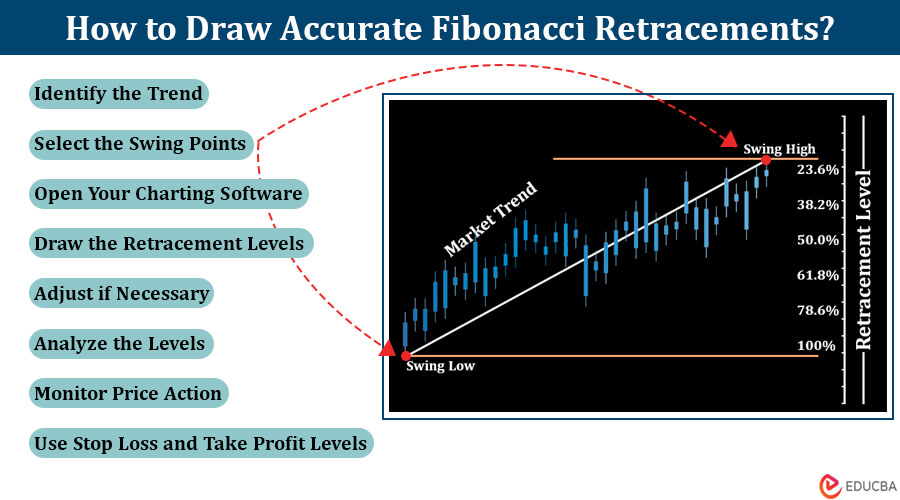
How to Draw Accurate Fibonacci Retracements?
Getting your fibonacci retracement tool in the right place on the chart is critical for good levels. Here are some key tips:
1. Identify the trend
Determine the overall trend in the market. Fibonacci retracements often identify potential reversal levels in an existing trend.
2. Select the swing points
Identify the major swing points in the trend. Swing points are the peaks and troughs that define the trend. For an uptrend, choose the lowest point (trough) and the highest point (peak), and for a downtrend, select the highest point (peak) and the lowest point (trough).
3. Open your charting software
Use a platform or software that lets you draw fibonacci retracement levels. Many trading platforms, like TradingView, have tools for this.
4. Locate the fibonacci retracement tool
Look for the tool in your charting software. It’s often a diagonal line with percentage levels (23.6%, 38.2%, 50%, 61.8%, and 78.6%).
5. Draw the retracement levels
Click on the swing low point (for an uptrend) or swing high point (for a downtrend) and drag the fibonacci retracement tool to the opposite swing point. This creates the retracement levels on your chart.
6. Adjust if necessary
Adjust the tool to fit the market better if the price doesn’t match the fibonacci levels perfectly. You can fine-tune it by dragging its endpoints.
7. Analyze the levels
Pay attention to the key fibonacci retracement levels, particularly the 38.2%, 50%, and 61.8% levels. These are considered significant areas where price may experience support or resistance.
8. Combine with other analysis
Use fibonacci retracement levels with other technical analysis tools and indicators. Using multiple methods improves the accuracy of your predictions.
9. Monitor price action
Once the Fibonacci retracement levels are drawn, monitor how the price reacts around these levels. Look for confirmation signals such as candlestick patterns, trendlines, or other technical indicators.
10. Use stop loss and take profit levels
Implement risk management strategies by setting stop-loss orders below support levels (in an uptrend) or above resistance levels (in a downtrend). Additionally, set take-profit levels based on your analysis.
Final Thoughts
By plotting key Fib ratios, you can identify hidden support and resistance areas on your charts where high-probability reversals are likely. Combining strategies based on Fibonacci with signals from other indicators strengthens your trading approach. However, always test your strategy and use proper risk management, including setting stop losses for each trade. Moreover, the fibonacci retracement course can offer traders a powerful weapon in their arsenal.
Recommended Articles
If you found this article on Fibonacci Retracement useful, please check out the following recommendations:

