Financial Modeling
Financial modeling is a technique used by companies for financial analysis in which the income statement, balance sheet, and cash flow statement of a company are forecasted for the next five to ten years. It includes preparing detailed company-specific Excel models, which are then used for the purpose of decision-making and performing financial analysis.
It is nothing but constructing a financial representation of some or all aspects of the firm or given security. For example, K&B company makes a profit of $2,000,000 in the year 2022. As per their financial model, their growth rate is 5% yearly. Therefore, they are expecting to make a profit of $2,100,000 in 2023.
Planners use different types of financial modeling, varying in complexity, as they cater to different situations like valuations, analysis for sensitivity, and analysis for comparative studies. The analysts use the top-down approach to work from an outside perspective, moving toward the details. Typically industry estimates are a starting point and narrow into targets that fit your company.
Key Highlights
- Financial modeling uses data like revenue, expenses, income statement, balance sheet, and cash flows on a spreadsheet to forecast a company’s financial performance.
- It forecasts using the three financial statements: profit and loss, cash flow, and balance sheet.
- There are different types of models like the 3-Statement Model, Valuations and DCF Models, Merger Models, and Leveraged Buyout Models.
Why Financial Modeling is Needed?
Financial modeling is prepared for multi-purpose. It is used for financial analysis, decision-making, and understanding the company’s financial position and performance. Following are some of the scenarios where financial models are being used.
- Forecasting the financial performance (i.e.) financial planning and budgeting for the future period.
- Analyzing the performance of the company against targets and goals.
- Valuation of the business.
- Comparing the company’s performance with that of peers and competitors in the industry.
- Analyzing the financial statements and ratios.
- MIS preparation and management accounts.
- Estimating the financial metrics of new projects.
- Allocation of the company’s resources.
- Strategic planning and decision-making.
- Investment planning and capital budgeting.
- Mergers/ Acquisitions and divestment of business/ assets.
- Analyzing the capital structure (Debt/ Equity)
Who Builds Financial Models?
- Investment Bankers build them to predict the impact of future investment decisions of the firm.
- A Financial Research Specialist in an equity research division of a financial giant analyzes a company’s decision to invest in a deal.
- A startup business owner fetches funding for the startup and builds a model to show the viability of the company’s financial behavior over the years.
- A financial analyst working with real-estate companies builds models to predict the valuation or devaluation of the properties.
Financial Modeling Types with Examples
3-Statement Model (Income Statement, Balance Sheet, and Cash Flow Statement):
- It deals with the revenue of the company, its expenses, and the flow of cash. It helps get a statistical number that predicts the company’s financial position.
- The income statement helps predict the company’s expenses, revenues, taxes accumulated over a while, and its Net-income, including its profits from the tariffs.
- The balance sheet formulates the resources and assets of the company that can predict benefits, liabilities, and the net equity derived from the valuations.
- The cash flow statement assists in merging the net income of the company and the cash it generates, keeping the inflow and the outflow of money in balance.
- It also helps the company from hiding its non-cash revenues and expenses that can affect the income statement.
- The three-statement model is helpful for the budgeting process and helps make predictive investment decisions by looking at the graphical representations of valuations.
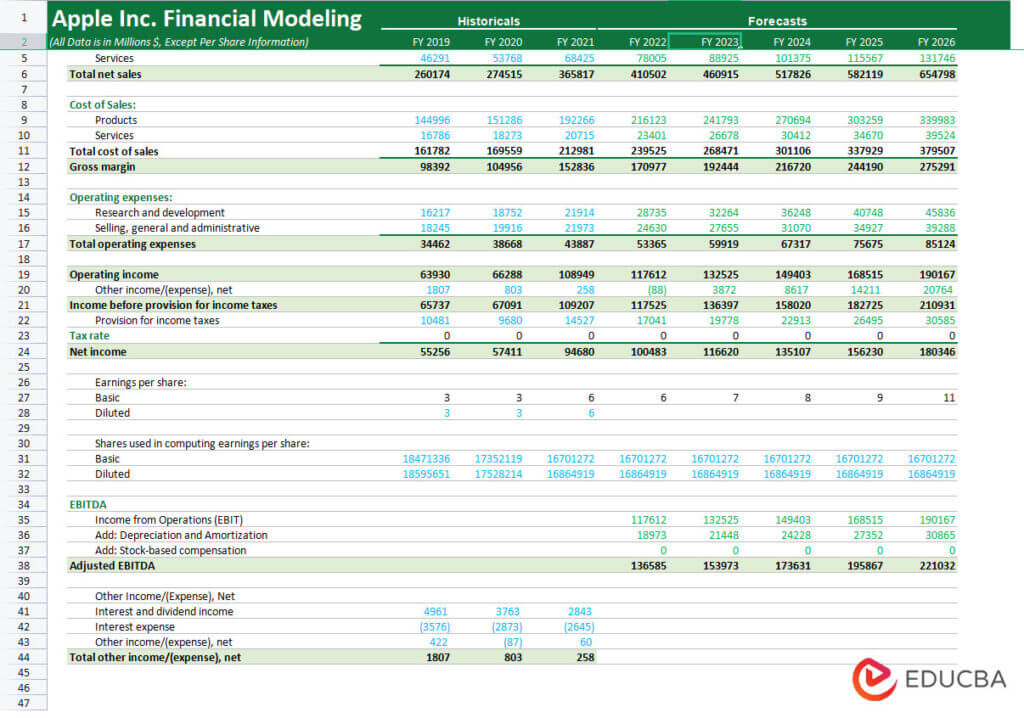
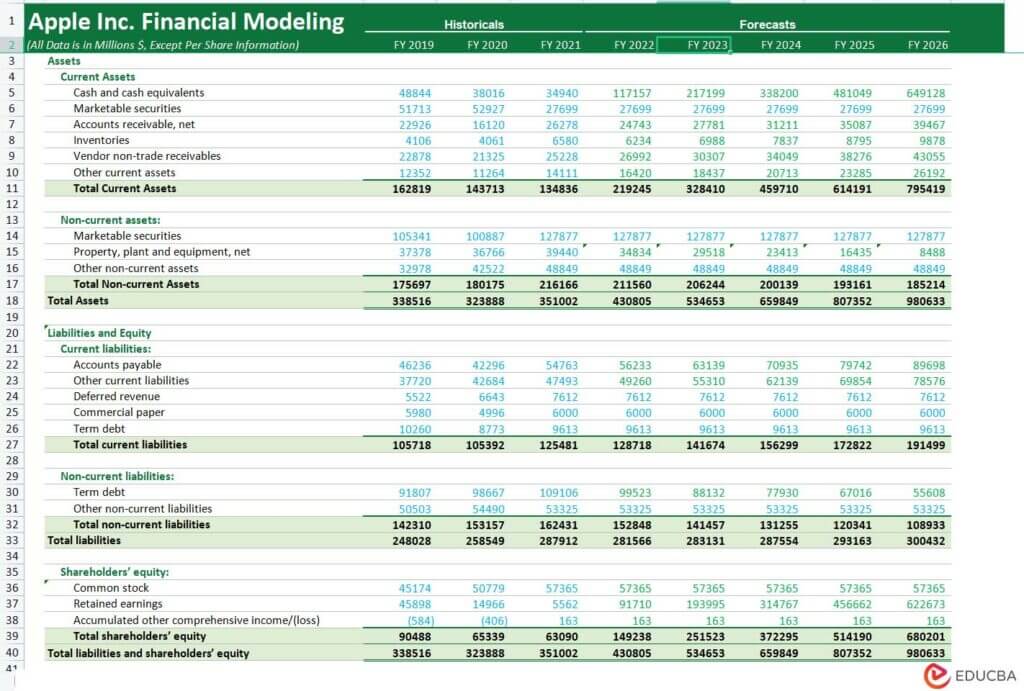
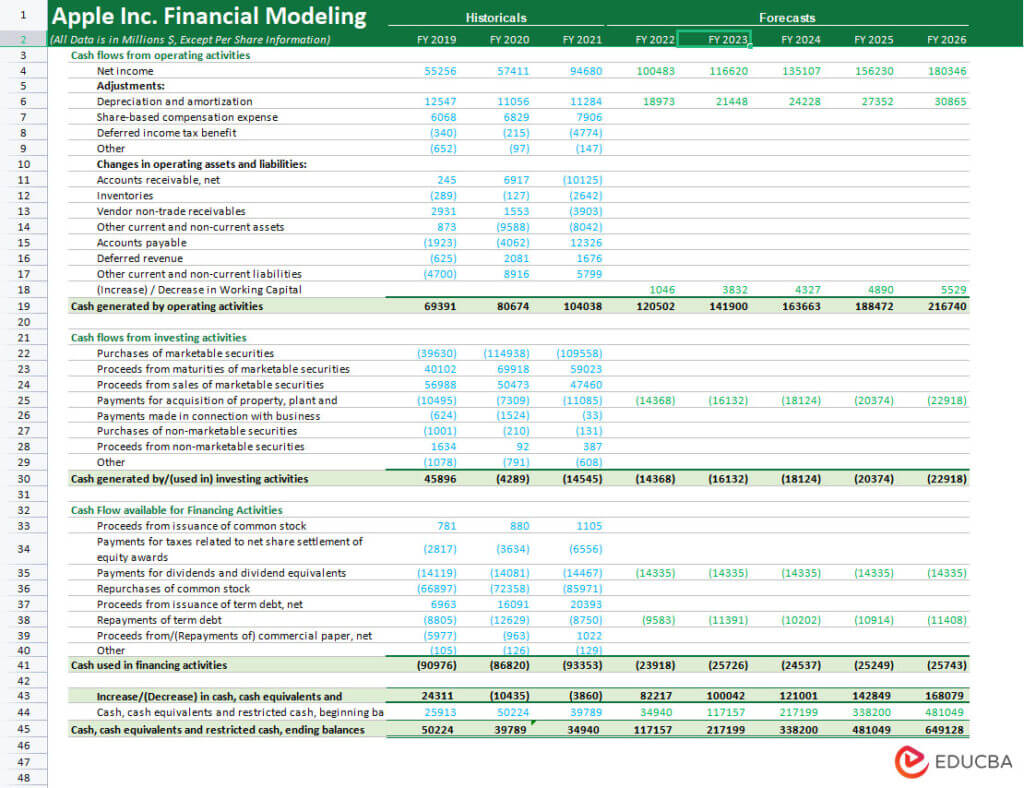
Example: Apple Inc.
Here is a financial model for Apple Inc. We have included historical data.
Income Statement
(Image Source: eduCBA Course)
Balance Sheet
(Image Source: eduCBA Course)
Cash Flow Statement
(Image Source: eduCBA Course)
DCF Model:
- Estimating the array of values is worth formulating. It predicts if the valuation is under-valued, over-valued, or appropriate.
- In a DCF model, the company’s cash flow concerns a predictive analysis into a future cash flow model with regards to 5, 10, or 20 years, discounted to its present value. It indicates the current worth concerning that you can invest, keeping the rate of return constant.
- The DCF model focuses on a company’s revenue, expenses, and cash flow-like items.
- Most items are non-recurring; hence, a partial income statement and a cash flow statement are sufficient.
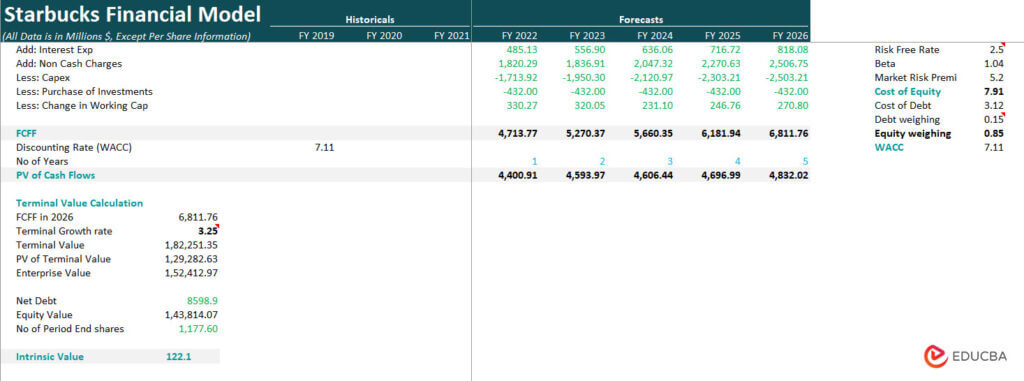
Example: Starbucks
Here is a financial model for Starbucks, using the historical information from 2019 to 2021 to forecast finances from 2022 to 2026.
(Image Source: eduCBA Course)
Leveraged Buyout Models (LBO):
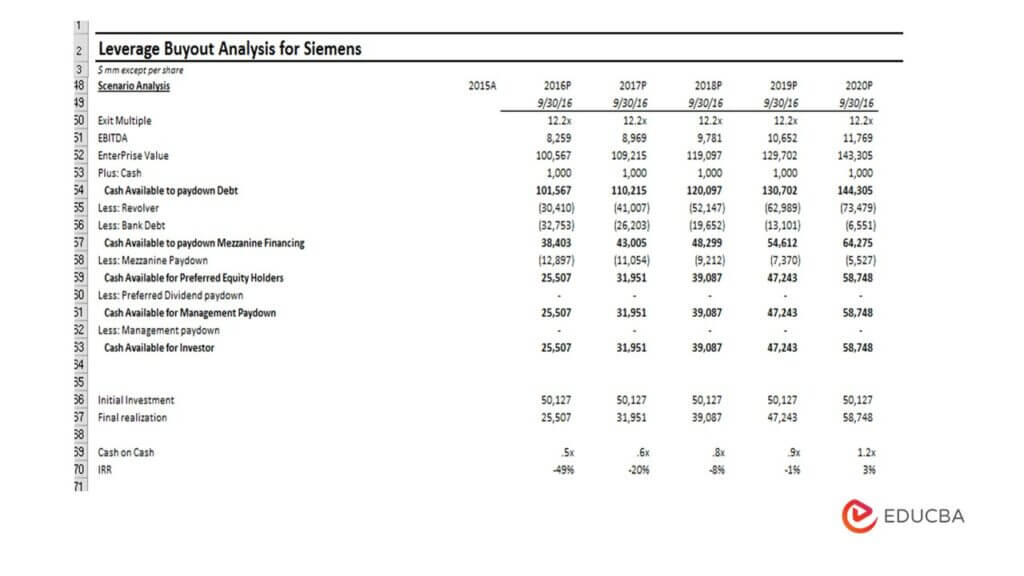
- It is the extended form of the 3-statement model. In such models, it deals with the multiple or annualized rates of return that can benefit the investor by holding the stake and selling it when needed.
- The investment returns integrate with the company’s cash flow and growth rate.
- It also depends on the company’s free cash flow after paying for the funding costs, such as interest on Debts.
- The purchase price, holding values, and cash flow during the holding period assists in generating invested capital and IRR (Internal rate of return).
- The private equity firms utilize the hedge funds in the form of Debt financing and Equities to generate mergers and acquisitions concerning the company’s affairs with potential buyers and sellers.
Example: Siemens
Here is the Siemens LBO model. It forecasts the company’s finances from 2016 to 2020, considering LBO.
(Image Source: eduCBA Course)
Merger Models:
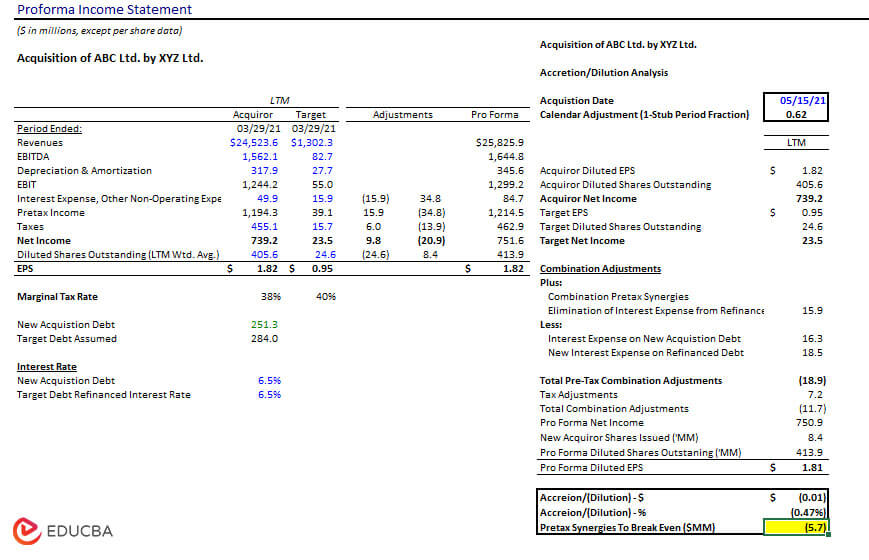
- It involves two companies rather than one. It helps determine if the small company’s acquisition benefits the larger company in terms of profitability.
- It depends on the statement of operations and the cash flow statement.
- Other indicators are the price paid for the target, the sense of consideration that includes Cash, Debt, or New Shares Issued, and expected ways for the company to cut costs or to increase the sales valuations.
- It is also essential to have a fundamental understanding of the analysis done to justify the merger.
- It is an acting agent for negotiating a deal.
Example: ABC & XYZ Ltd.
Here is the merger financial model for ABC & XYZ Ltd.
(Image Source: eduCBA Course)
Steps to Build Financial Model
Step 1: Data Collection & Projection
- Financial modeling involves collecting data from general financial statements.
- It is helpful in historical analysis that goes handy with projections.
- Check the trends for the past years and project the data on the model.
- Additionally, we can also formulate data analysis to implement the financial analysis.
Step 2: Computations and Assumptions
- The past analysis gives an insight into future events.
- However, assumptions and hypotheses are essential to accurate financial modeling.
- Make valid and correct assumptions for metrics, such as cash flow, growth rate, etc.
Step 3: Projecting Forecasts
- After assumptions, forecast future finances based on the historicals.
- Forecasting will prevent the company from making losses by structuring a cost-benefit analysis.
- Revenue structure and investment analysis can help the investor to invest in the company’s equity structures.
Step 4: Evaluation & Analysis
- Swot analysis assists the financial analyst in judging a company’s strengths and weaknesses.
- Impact Evaluation helps in underscoring the revenue structure and provides a graphical representation of the past, present, and prospects.
- Evaluation structures help analyze the models created and engage the stakeholders to manage their portfolios.
Step 5: Testing
- Perform several tests on the model to verify its robustness and reliability.
- You can do the stress, sense, and structure testing to analyze the effectiveness of your model.
Testing
Sense Checking:
- Model output is one of the most important indicators of company performance.
- Peer review helps improve the valuations that can lead to marginal success in the revenue.
- The story-telling ability of the valuation model will judge the competitiveness of the company’s financial health.
- Evaluation and analysis of the impact projects are the key indicators of sense checking.
Structure Checking:
- Error diagnosis saves time in managing the loopholes during the valuations.
- The models run through LDA diagnosis that prevents them from loss analysis.
- Marginal profit is the key function of developing financial modeling that helps the company in the long run.
Stress Testing:
- In stress testing, the analyst makes a substantial change in the model’s assumption and predicts how the model should behave.
- If the result is similar to what was expected, the analyst should revert the data to its original data.
- Building macro-indicators helps in validating the stress of the profit & loss analysis.
Financial Modeling Skills
The key skills required to build a financial model are listed below.
- Strong understanding of accounting, financial statements, and other financial metrics.
- Good knowledge of Excel is a must to build a financial model, as all the models are created in Excel.
- Knowledge to link the three statements (Balance sheet, Statement of Profit & Loss, and cash flow statement).
- Knowledge to build the forecast model.
- Logical understanding and problem-solving skills.
- Eye for details.
- Ability to handle a large volume of data and to put it in a simple and meaningful format.
- Good presentation skills.
- Ability to meet business requirements and help in strategic decisions by building the right model.
Prerequisites to Building a Financial Model
- The model building involves the usage of Excel. Thus, knowledge of Excel is necessary.
- Soft skills such as problem-solving and attention to detail are essential for those who create models.
- Due to the large volume of information and the complexity of some models, an eye for detail is crucial for sound financial modeling.
- Concepts like accruals, depreciation, revenue recognition, and matching principle are just a few of the accounting concepts you’ll need for financial modeling.
Financial Modeling in Investment Banking
- The Investment Banks use financial modeling to predict the firm’s investment decisions.
- Investment banking helps to raise money and underwrite equity securities and new debts for governments, companies, and other entities. It facilitates reorganizations, M & A- mergers and acquisitions, and broker trades for private investors and institutions.
- Investor bankers do the financial planning and management for governments, corporations, and large projects of other groups.
- Therefore, the financial model for investment banks is a very crucial requirement.
- For example, Goldman Sachs spends around 10% of its revenue in building these models because it can help them generate 100% of the revenue based on better investment decisions, predictive analysis, and forecasting related to investments around the clientele base.
Common Financial Modeling Approaches
Financial Modeling – Income Statement: Line Item Drivers
a) Financial Modeling –
Revenues Projections for any company are a fundamental driver of economic performance. Hence, a well-designed and logical revenue model reflecting accurately the type and amounts of revenue flows is extremely important. There are as many ways to design a revenue schedule. Some common types include:
- Sales Growth: Sales growth assumption in each period defines the change from the previous period. This is a simple and commonly used method but offers no insights into the components or dynamics of growth.
- Inflationary and Volume/ Mix effects: Instead of a simple growth assumption, a price inflation factor and a volume factor are used. This useful approach allows the modeling of fixed and variable costs in multi-product companies and takes into account price vs volume movements.
- Unit Volume, Change in Volume, Average Price, and Change in Price: This method is appropriate for businesses that have a simple product mix; it permits analysis of the impact of several key variables.
- Dollar Market Size and Growth: Market Share and Change in Share – Useful for cases where information is available on market dynamics and where these assumptions are likely to be fundamental to a decision. For Example – the Telecom industry.
- Unit Market Size and Growth: This is more detailed than the preceding case and is useful when pricing in the market is a key variable. (For a company with a price-discounting strategy, for example, or a best-of-breed premium-priced niche player) e.g. Luxury car market
- Volume Capacity, Capacity Utilization, and Average Price: These assumptions can be important for businesses where production capacity is important to the decision. (In the purchase of additional capacity, for example, or to determine whether expansion would require new investments.)
- Product Availability and Pricing
- Revenue driven by investment in capital, marketing, or R&D
- Revenue-based on installed base (continuing sales of parts, disposables, services, add-ons, etc). Examples include classic razor-blade businesses and businesses like computers where sales of service, software, and upgrades are important. Modeling the installed base is key (new additions to the base, attrition in the base, continuing revenues per customer, etc).
- Employee-based: For example, revenues of professional services firms or sales-based firms such as brokers. Modeling should focus on net staffing and revenue per employee (often based on billable hours). More detailed models will include seniority and other factors affecting pricing.
- Store, facility, or Square footage based: Retail companies are often modeled based on the basis of stores (old stores plus new stores each year) and revenue per store.
- Occupancy-factor-based: This approach is applicable to airlines, hotels, movie theatres, and other businesses with low marginal costs.
b) Financial Modeling – Costs projections Drivers include:
- Percentage of Revenues: Simple but offers no insight into any leverage (economy of scale or fixed cost burden).
- Costs other than depreciation as a percent of revenues and depreciation from a separate schedule: This approach is really the minimum acceptable in most cases and permits only partial analysis of operating leverage.
- Variable costs are based on revenue or volume. Fixed costs are based on historical trends and depreciation from a separate schedule. This approach is the minimum necessary for sensitivity analysis of profitability based on multiple revenue scenarios.
c) Financial Modeling – Operating expenses
- General and Administrative: Generally treated as % of revenues
- Sales and Marketing: Generally modeled as % of revenues. In some cases, it is actually a revenue driver and not driven by revenues. For example, brokerage businesses or pure plays trading and marketing firms.
- R&D: Generally, R&D costs are treated as % of revenues.
d) Financial Modeling – Interest expense (or Net interest expense):
- This is one of the few income statement items that is driven by balance sheet information. An interesting schedule is generally developed to i) calculate interest received on cash and short-term investments and ii) calculate interest expenses arising from all types of debt. Interest rate assumptions are needed.
- The ending balance of the previous year can be used to calculate interest expenses to avoid circular references in Excel
- Average balance can be used as well (it will give circular reference though)
e) Financial Modeling – Income taxes
- The effective tax rate is generally used in most cases. The effective rate is calculated as Taxes paid / Pre-Tax income.
- For future years, either the marginal tax rate equivalent to the country of incorporation is taken or if the effective rate is much lesser than the marginal tax rate, then during the initial years, the tax rate can be low but gradually would have to be moved to the marginal tax rate. For example, In India, the marginal corporate tax rate is 33%.
Balance Sheet: Line Item Drivers (Assets)
- Cash and Cash Equivalents:
- Linked to cash from Cash Flow Statement
- Accounts Receivable (Part of Working Capital Schedule):
- Generally modeled as Days Sales Outstanding;
- Receivables turnover = Receivables/Sales * 365
- A more detailed approach may include aging or receivables by business segment if the collections vary widely by segments
- Receivables = Receivables turnover days/365*Revenues
- Inventories (Part of Working Capital Schedule):
- Inventories are driven by costs (never by sales);
- Inventory turnover = Inventory/COGS * 365; For Historical
- Assume an Inventory turnover number for future years based on historical trends or management guidance and then compute the Inventory using the formula given below
- Inventory = Inventory turnover days/365*COGS; For Forecast
- Other Current Assets (Part of Working Capital Schedule):
- Modeled as % of sales
- Fixed Assets (Property, Plant, and Equipment)
- A separate schedule is prepared, taking into account various components
- Ending Balance for PPE = Beginning balance + Capex – Depreciation – Adjustment for Asset Sales
Balance Sheet: Line Item Drivers (Liabilities)
- Financial Modeling – Current Liabilities Projections
- Accounts Payables (Part of Working Capital Schedule):
- Payables turnover = Payables/COGS * 365; For Historical
- Assume Payables turnover days for future years based on historical trends or management guidance and then compute the Accounts Payables using the formula given below
- Accounts Payables = Payables turnover days/365*COGS
- Short-Term Debt: Usually modeled as part of the debt schedule
- Accrued Liabilities: Kept constant most often; Can be modeled as % of sales
- Deferred taxes: Kept constant most often; Can be modeled as % of sales
- Other Current Liabilities: Can be modeled as % of COGS or as % of Sales
- Long-term Liabilities:
- Deferred taxes: Kept constant most often; Can be modeled as % of sales
- Post-retirement Pension Cost: Kept constant most often
- Long-term Debt: Usually modeled as part of debt schedule (please refer to debt schedule on next page)
- A key feature of the debt schedule is to use the Revolver facility and how it works so that the minimum cash balance is maintained and ensures that the Cash account does not become negative in case the operating cash flow is negative (Companies in the investment phase who need a lot of debt in initial years of operation – Telecom cos for example)
- The overall range of Debt to equity ratio should be maintained if there is any guidance by the management
- The debt balance can also be assumed to be constant unless there is a need to increase the debt
- Notes to the accounts would give repayment terms and conditions which need to be accounted for while building the debt schedule
- For some industries, like Airlines, Retail, etc, Operating Leases might have to capitalize and convert to debt. However, this is a complex topic and beyond the scope of discussion at this point
Financial Modeling Example
ABC Corporation wants to value its business, and they have adopted discounted cash flow financial modeling to find the valuation. They are projecting for the period 2023 to 2026 using the DCF model. From the projected P&L and Balance sheet, they have obtained the EBIT and other required data, 10% as a discount factor and 5% growth factor YoY is considered for the model. The purpose of the below calculation is to find the valuation of the business. This model is used for obtaining external funding, disinvestment, and investment options.
| Discounted Cash Flow | 2022 | 2023 | 2024 | 2025 | 2026 |
| EBIT | 50,000 | 52,500 | 55,125 | 57,881 | 60,775 |
| Less: Tax on EBIT | 15,000 | 15,750 | 16,538 | 17,364 | 18,233 |
| Add: Dep & Amortisation | 7,500 | 7,500 | 7,500 | 7,500 | 7,500 |
| Less: Changes in NWC | 400 | 490 | 480 | 510 | 530 |
| Unlevered Free Cash Flow | 42,100 | 43,760 | 45,608 | 47,507 | 49,513 |
| Discounting factor | 1 | 0.91 | 0.83 | 0.75 | 0.68 |
| DCF | 42,100 | 39,782 | 37,692 | 35,693 | 33,818 |
| Total valuation | |
| Present Market value | 300,000 |
| NPV of cash flows | 189,084 |
| Total valuation | 489,084 |
| Assumptions | |
| Tax Rate | 30% |
| Discount Rate | 10% |
| Growth Rate | 5% |
| Present Market value | 300,000 |
| Capex | 150,000 |
Who Should Study Financial Modeling?
Financial Modeling could be beneficial to a vast majority of people. Some of the cases are summarized below
- The aspirants of the Financial Modeling Course can be everybody who wants to explore the world of finance and get involved in money-related decision-making. These people can be Executives, Business planning and strategy deciders, Managers working with Banks, Equity Researchers, Project Managers, Research Analysts, Investment Banking people, Portfolio Managers, Commercial Bankers, Risk Managers, Accountants, and all those who are part of the finance department in all types of the firms
- It’s an added advantage for those people who are pursuing CA, MBA, CFA, FRM, and Commerce graduates
- Candidates having a Degree, Diploma in technical fields like B.TECH or Engineering and want to make a career in finance
- Any individual who just wants to gain knowledge out of passion or curiosity
Now after knowing Who can do Financial Modeling Course now, let us look at all it needs to go for financial modeling training.
Tricks & Tips for Error-free Modeling
- Data scraping and format sourcing are the prerequisites for successful valuations.
- The formula structure should remain constant to avoid irregularities.
- Typing error avoidance is a must.
- Error-free check helps in formulating consistencies.
- Historical analysis is the bread-and-butter of the valuations.
- Building suitable models and keeping a flow check helps in minimizing errors.
Best Practices in Financial Modeling
In Financial Modeling, it is desired that the work be errorless and easier to read and understand for audit purposes. By following these key principles, the model will be easier to navigate and check and reliable.
- For the most obvious results, we need to follow the firm’s standard format
- Maintaining an appropriate number of sheets
- Using page breaks wherever required
- Writing Executive Summary on top if desirable
- Maintain versions of documents if future upgradations are expected
The following points should be kept in mind:
Spreadsheet Design
- Modular spreadsheet blocks will make changing individual sheets simpler and more independent.
- Proper protection should be given to the sheets and workbooks from unauthorized usage.
- Labeling sheets, columns, and rows with their applicable headings so that files will become easy to follow.
Better Document Your Assumptions
- Assumptions documentation helps with validation & avoids misinterpretation.
- Listing assumptions will be helpful for easier and quicker understanding.
- Adding source data as well as calculations will provide a good map.
Use Linking and not Hard-coding
- Linking wherever required is a good practice, as when the inputs change, the outputs will change automatically
- This will save lots of hassles at the final stage or at the working stage
Facilitate Data Entry in One Place Only
- Avoid retyping data. Entering it once as a source and referencing it will make good sense.
- It’s always better to link cell values rather than write the numeric value for calculations.
Good Practice is Using Consistent Formulas
- It will be accurate and efficient to use formulas and functions.
- Do not copy the formula from one sheet to another, as it will create links in files.
- Avoid unnecessary blank columns and rows, as this can be tedious at the time of making tables or other charts.
- Creating Templates will be beneficial
Formatting Charts
- Be precise with the chart axes’ scale
- Creating a VBA Style Guide containing rules and details about coding standards is good
Format and Label Clearly
- It’s very important to format cells appropriately i.e. we should follow standard practices eg. should use symbols for currency, percentages values, etc., which will make the model easier for reading.
- In Financial Modeling clear labeling is very important to improve readability
- Try using different background colors for distinguishing input areas and calculation parts
Final Thoughts
Companies need financial modeling to build an economically viable business, prepare for the future, communicate performance to potential shareholders or new investors, or set targets. They may take either of the two approaches, the top-down or the bottom-up approach or preferably combine them. A startup’s model outputs typically consist of a three- to five-year forecast.
Frequently Asked Questions (FAQs)
Q1. What is a financial model?
Answer: A financial model represents the business operation of a company using a spreadsheet. It is a summary of the overall business’s costs and income, which can help make vital decisions in the future. Financial modeling forecasts calculate and estimate financial numbers. These mathematical models include variables that are linked together.
Q2. Who uses financial modeling?
Answer: Businesses use it for company evaluation and analyzing their finances. In addition, it is helpful in other sectors, such as banks, nonprofit & government organizations, real estate, financial institutions, and more. Moreover, company executives, financial analysts, portfolio managers, and investors use it to understand organizations’ performance.
Q3. What are the types of models in financial modeling?
Answer: The significant models are the 3-statement model, Leveraged Buyout Model (LBO), and Merger or M&A model. Additionally, the Discounted Cash Flow (DCF) model and Value-at-Risk (VAR) models are some of the most complex models used for risk management.
Q4. Where can you learn financial modeling?
Answer: One can enroll in various online and offline courses to learn financial modeling. EDUCBA offers a comprehensive financial modeling course. It is an accomplished pedagogy across seven classes and 14+ projects aiming to put theory into practice. It is a certification program with 100+ hours of tutorials with the feature of lifetime access.
[socialWarfare]