Updated July 26, 2023
Definition of Gross Profit Ratio
The term “gross profit ratio” refers to the profitability measure that is computed by deducting the costs of production that can be directly allocated to the manufacturing unit, such as the cost of raw material, direct labor cost, etc.
In other words, it helps in computing how much of every dollar of revenue is left post deduction of all the direct cost of production (also known as the cost of sales or cost of goods sold).
Theoretically, the higher the GPR, the better it is for the company. The excess money can be used to pay off other operating expenses, such as selling, general & administrative, marketing, and interest expenses. On the other hand, a low or negative GPR is a warning signal as it indicates a company’s weak operating performance.
Formula
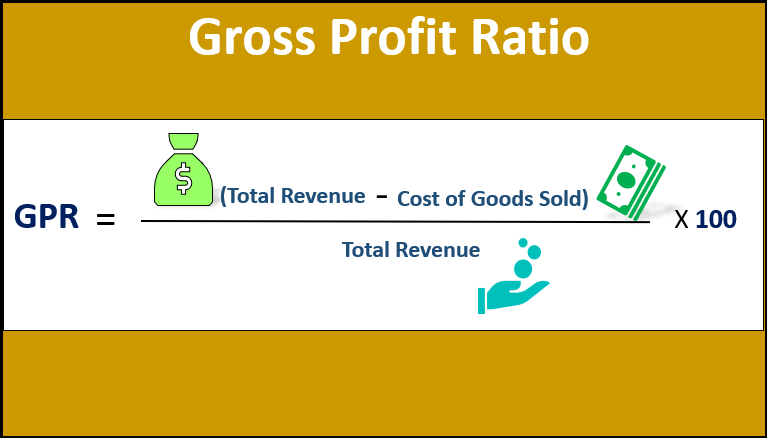
The formula for deriving the Gross Profit Ratio involves deducting the cost of goods sold from the total revenue and dividing the resulting value by the total revenue. The ratio is commonly expressed as a percentage. The formula is as below:
The total revenue is derived by multiplying the average selling price per unit by the number of units sold. On the other hand, the cost of goods sold primarily comprises raw materials and direct labor costs. Both are important financial metrics and as such, they are easily available in any company’s income statement.
Examples of Gross Profit Ratio (With Excel Template)
Let’s take an example to understand the calculation of the Ratio in a better manner.
Example – #1
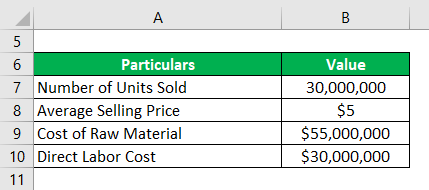
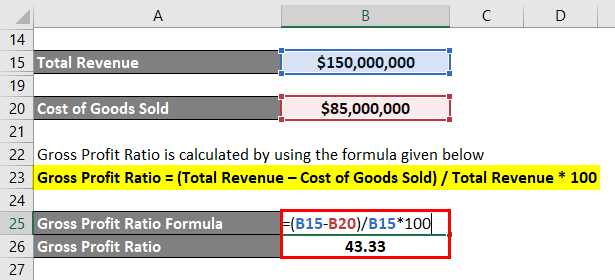
Let us take the example of GHJ Ltd in order to demonstrate how to calculate the GPR of a company. GHJ Ltd is a toy manufacturing company, and according to its latest income statement, the company sold 30,000,000 different types of toys during the year at an average selling price of $5. Also, the cost of raw materials and direct labor cost of production during the year stood at $55 million and $30 million, respectively. Based on the given information, calculate the gross profit ratio of GHJ Ltd during the year.
Solution:
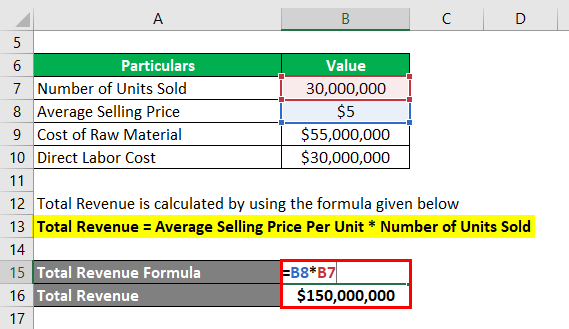
The formula used to calculate the total revenue is as follows:
Total Revenue = Average Selling Price Per Unit * Number of Units Sold
- Total Revenue = $5 * 30,000,000
- Total Revenue = $150,000,000
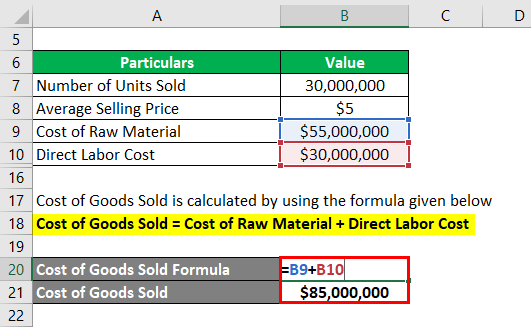
The formula used to calculate the cost of goods sold is as follows:
Cost of Goods Sold = Cost of Raw Material + Direct Labor Cost
- Cost of Goods Sold = $55,000,000 + $30,000,000
- Cost of Goods Sold = $85,000,000
The formula used to calculate the ratio is as follows:
Gross Profit Ratio = (Total Revenue – Cost of Goods Sold) / Total Revenue * 100
- GPR = ($150,000,000 – $85,000,000) / $150,000,000 * 100
- GPR = 43.33%
Therefore, GHJ Ltd managed a gross profit ratio of 43.33% during the year.
Example – #2
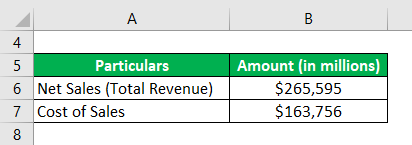
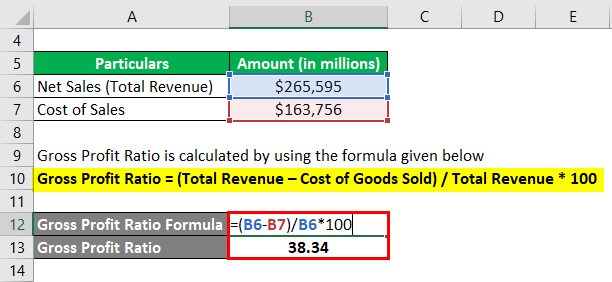
Let us now take the annual report of Apple Inc. for the year 2018. According to the latest annual report, the company registered net sales of $265,595 million, while the year’s sales cost stood at $163,756 million. Calculate the gross profit ratio for Apple Inc. for the year 2018.
Solution:
The formula used to calculate the ratio is as follows:
Gross Profit Ratio = (Total Revenue – Cost of Goods Sold) / Total Revenue * 100
- GPR = ($265,595 million – $163,756 million) / $265,595 million * 100
- GPR = 38.34%
Therefore, Apple Inc. registered a gross profit ratio of 38.34% during the year 2018.
Source: Apple’s Annual Report
Example – #3
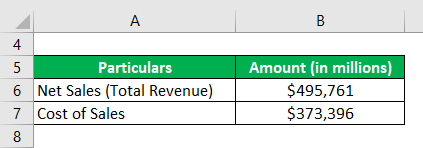
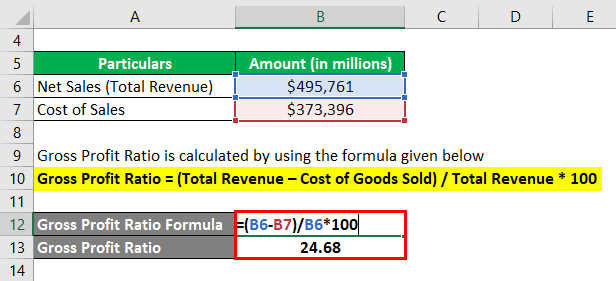
Let us now take the annual report of Walmart Inc. for the year 2018. As per the latest annual income statement, the company’s net sales and cost of sales stood at $495,761 million and $373,396 million, respectively. Calculate the gross profit ratio for Walmart Inc. for the year 2018.
Solution:
Gross Profit Ratio = (Total Revenue – Cost of Goods Sold) / Total Revenue * 100
- GPR = ($495,761 million – $373,396 million) / $495,761 million * 100
- GPR = 24.68%
Therefore, Walmart Inc. managed a gross profit ratio of 24.68% during the year 2018.
Source: Walmart Annual Reports (Investor Relations)
Advantages and Disadvantages
Advantages
- The ratio gives a fair idea about the operating efficiency of a company.
- This ratio can be used to monitor a company’s operating performance over a certain period of time vis-à-vis its peers.
Disadvantages
- It does not include all the expenses, such as interest expenses, selling expenses, etc. As such, the ratio fails to present the true state of its overall profitability.
- Very difficult to benchmark what is an acceptable level GPR.
Conclusion
So, the gross profit ratio can be a useful profitability metric. But it cannot be used as a standalone ratio and should be complemented by other performance metrics to draw meaningful insights.
Recommended Articles
Here we discuss the introduction, examples, advantages, and disadvantages along with a downloadable Excel template. You can also go through our other suggested articles to learn more –
