Updated June 12, 2023
Introduction to Heatmap in MATLAB
Do you know what is a heat map and for what purpose it is good? First of all, let’s introduce what is MATLAB? MATLAB is a registered and high-performance programming language developed by Math Works. MATLAB is aimed for technical calculating. It allows matrix operations, the plotting of functions and data, and the execution of algorithms.
Further, Heatmap in MATLAB also helps to produce user interfaces that interface with programs written in other languages, comprising C, C++, Java, FORTRAN, and Python. Now we can define HeatMap Basically, “Heatmap is Matlab software for graphical representation of data where color-coded systems are used. ” The objective of Heat Maps to visualize the volume of locations or events in a better way within a dataset. It also helps in directing audiences towards the areas on data visualizations.
We use a heat map chart which is a particular chart that represents data values in the table with the help of colors. This is applicable when we have to design large and complex data. Heatmap works by saving the data from a web page. Suppose if any part of a web page gets more attention or if the contents on the webpage are clicked frequently then, heatmap uses a dark-to-light color to represent it.
For example, the contents are displayed with a dark color which is viewed more and the other area with no attention from visitors is displayed by light color.
How to Create Heatmap in MATLAB?
Since we know that MATLAB is a language deliberated for mathematical and scientific purposes that has many tools to deal with most areas of Maths and Science. It enhances computation, visualization, and programming in an easy-to-use environment. This allows the problems and solutions to be conveyed in a familiar mathematical representation.
Therefore, now let’s talk about HEATMAP in MATLAB; Heatmap is useful to display a matrix as an image whose color intensities give the magnitude of its values.
Also, it empowers you to identify the following things:
- X-axis and Y-axis tick labels: To Show the row or column directories or any other numeric or text markers. Here, X-axis tick labels can be interchanged.
- Text labels: Connects the heatmap image with the help of organized text labels. We can switch the font size and font color of the labels. But the labels while zooming, panning or resizing the figure can be updated automatically.
- Custom color maps: To specify your own colors, we can use MATLAB’s default color maps. Also, we can have different color maps for different heat maps in a figure.
Other parameters are such as grid lines, color bars for configuration while` preparing Heatmap.
Those who are familiar with Matlab and knows how it works and the coding part they have a plus point to study Heatmap with ease. They have an interest in graphical representation and can understand the Heatmap process more easily as well as the functions.
Syntax to Create a Heatmap chart:
h = heatmap (htbl,xvar,yvar)
h = heatmap (htbl,xvar,yvar,'ColorVariable',cvar)
h = heatmap (cdata)
h = heatmap (xvalues,yvalues,cdata)
h = heatmap (___,Name,Value)
h = heatmap (parent,___)
Explanation of these functions:
- The xvar is the table variable that displays along the x-axis. The yvar (input) is the table variable that displays along the y-axis. The colors are created on a count combination. Then it is used to change the heatmap once it is formed.
- The function h = heatmap (htbl,xvar,yvar) generates a heatmap from the table htbl and provides the object of the Heatmap Chart.
- The function h = heatmap (htbl,xvar,yvar,color variable’,cvar) is used to determine the color data using the table variable identified by cvar. Here, the mean combination is the basic calculation method.
- The Function h = heatmap (data) is useful to create a heatmap from the matrix. For a single value in data, the heatmap has only one cell.
- The function h = heatmap (xvalues,yvalues,cdata) determines values for the labels which are shown along x-axis and y-axis.
- The function h = heatmap (___, Name, Value) identifies more possibilities for the heatmap that uses single or multiple names or values couple arguments.
- The function h = heatmap (parent,___) forms the heatmap in the section indicated by the parent.
Examples of Heatmap in MATLAB
Given below are the examples of Heatmap in MATLAB:
Example #1
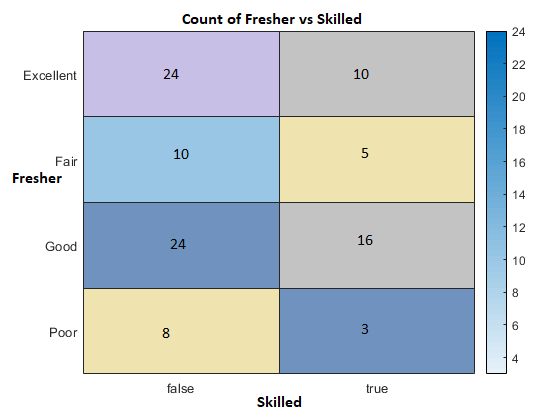
Build a heatmap from a table of data for sports students.
Firstly, we will load the students’ data set. Then make a table from a subset of the variables which is loaded into the workspace. After this, we generate a heatmap that totals the number of students having a matching set of Skilled and Fresher values.
Code:
load students

htbl = table (Name,Age,Gender,Fresher,...

Skilled,Weight,Location);

h = heatmap (htbl,'Skilled','Fresher');
Output:
Example #2
Make Heatmap from a Matrix Dataset
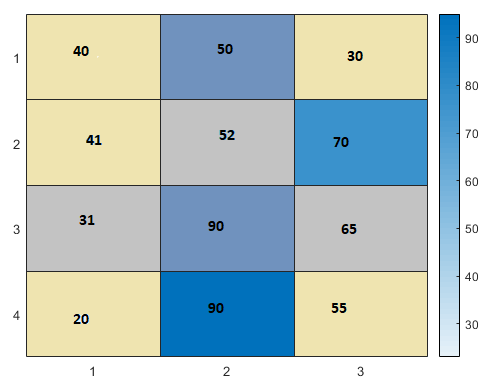
Generate a matrix of a dataset. Now, produce a heatmap of the values from the matrix. So, the labels along the x-axis and y-axis seem to be 1, 2, 3,.., etc.
Code:
cdata = [40 50 30; 41 52 70 ; 31 90 65; 20 90 55] ;

h = heatmap (cdata);
Output:
Example #3
Make Heatmap By Custom Axis Labels from Matrix Dataset.
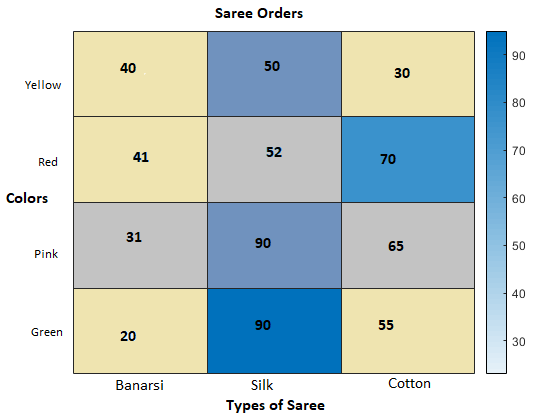
Firstly, we make a matrix of a dataset. Again generate a heatmap of the values. We will apply custom labels along the x-axis & y-axis and indicate the first two arguments to be labeled. Using the setting properties of the Heatmap Chart object, we need to identify the title and labels of an axis.
Code:
cdata = [40 50 30; 41 52 70 ; 31 90 65; 20 90 55] ;

xvalues = {'Banarsi','Silk','Cotton'};

yvalues = {'Yellow','Red','Pink','Green'};

h = heatmap (xvalues,yvalues,cdata);

h.Title = 'Saree Orders';

h.XLabel = 'Types';

h.YLabel = 'Colors';
Output:
Conclusion
Thus, we can say that a Heatmap is a data study software used to show user behavior on specific web pages or webpage templates where it uses color to display data i.e. data visualization tool. This supports finding out patterns giving a perspective of depth. Now mostly this tool is used for demonstrating complex statistical data.
Like doctors, engineers, sociologists, marketers, and researchers use heat maps to create difficult data sets to make logical and actionable Today we can see Heatmap has great importance. For example, on the weather, on real estate websites — mostly, where there is data to display, Heatmap is used. It has been a successful tool in Matlab because Heatmap can be represented in a self — illustrative natural way. Unlike the charts where it has to be read and the tables where it has to be implicit.
Recommended Articles
This is a guide to Heatmap in MATLAB. Here we discuss the introduction, how to create heatmap in MATLAB, and examples along with syntax. You can also go through our other related articles to learn more –


