Updated July 27, 2023
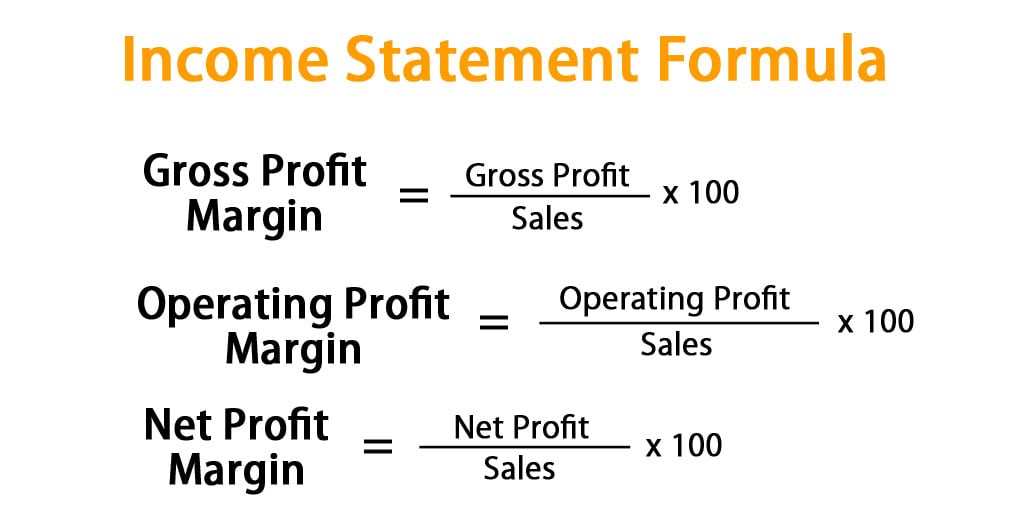
Analysts and investors rely on financial statements to assess a company’s profitability and financial health. One of the critical financial statements is the income statement, which reveals how much revenue a company earned and the expenses incurred during a specific period. To gain deeper insights into a company’s performance, analysts and investors use the income statement formula to calculate key financial ratios. These ratios include gross profit margin, net profit margin, and earnings per share, which provide essential information about a company’s financial performance.
By analyzing these ratios, individuals can evaluate a company’s profitability and make informed decisions about investing or managing the business.
Income Statement Formula
Here are some examples of commonly used income statement formulas and how to use them.
Example:
For example, if a business generates revenue of $20,000 in FY23 and the COGS is $8,000. Using the above formula, you can calculate the gross profit of the company along with its gross profit margin.
Gross profit = Revenue – COGS
= $20,000 – $8,000
= $12,000
Now we can calculate the gross profit margin:
Gross Profit Margin = (Gross Profit / Revenue) x 100%
=($12,000 / $20,000) x 100%
=0.6 x 100%
=60%
Therefore, the gross profit margin for this business is 60%.
Example:
Let us assume a leather manufacturing company accounted for sales of $50,000 for FY23. The COGS and operating expenses were $5,000 and $8000, respectively. Calculate the operating profit of the company along with its operating profit margin.
Operating profit = Sales – COGS – Operating expenses
= $50,000 – $5,000 – $8,000
= $37,000
Thus, the company’s operating profit for FY23 is $37,000
Now we can calculate the operating profit margin:
Operating profit margin = (Operating profit / Sales) x 100%
= ($37,000 / $50,000) x 100%
= 74%
Therefore, the operating profit margin for this leather manufacturing company for FY23 is 74%.
Example:
Let’s say Highlight Ltd. is a company that showed total revenue of $60,000 and total expenses of $25,000 in their income statement for FY23. Calculate its net profit and net profit margin.
Net profit = Total revenue – Total expense
= $60,000 – $25,000
= $35,000
So, the net profit made by Highlighted Pvt. will be $35,000.
Now we can calculate the net profit margin:
Net profit margin = (Net profit / Total revenue) x 100%
= ($35,000 / $60,000) x 100% = 58.33%
Therefore, Highlight Ltd.’s net profit margin for FY23 is 58.33%. This means that for every dollar of revenue earned, the company earned a net profit of 58.33 cents.
Income Statement Format
We have illustrated the format of the income statement through the table below:
| Infotech International Ltd. | |
|
Statement of Income For the Year Ended on December 31, 2022 |
|
| List Items | Amount |
| Sales | $100,000 |
| Cost of Goods Sold | $50,000 |
| Gross Profit | $50,000 |
| Operating Expenses | $5,000 |
| Selling Expense | $8,500 |
| Marketing Expense | $6,000 |
| Advertising Expense | $4,000 |
| Commission Expense | $2,000 |
| Office Operating Expense | $2,000 |
| Total Operating Expenses | $14,200 |
| Operating Income | $20,000 |
| Net Operating / Other Transactions | $15,500 |
| Revenue from Interests | $2,000 |
| Gain on Sale of Investments | $2,100 |
| Interest Expense | $500 |
| Total Non-Operating Expense | $300 |
| Net Income | $35,000 |
To generate an income statement, you need to follow the following steps:
- Choose a reporting period
- Generate a trial balance report for the period
- Calculate the revenue
- Determine the cost of goods sold
- Calculate the gross profit by subtracting the cost of goods sold from the revenue
- Include operating expenses
- Calculate the operating profit by subtracting operating expenses from the gross profit
- Include interest expenses or income
- Include payable taxes
- Calculate the net profit by subtracting taxes and other costs from the operating profit
- Finalize the income statement by presenting the figures correctly.
Examples of Income Statement Formula (With Excel Template)
Example #1 Nestle
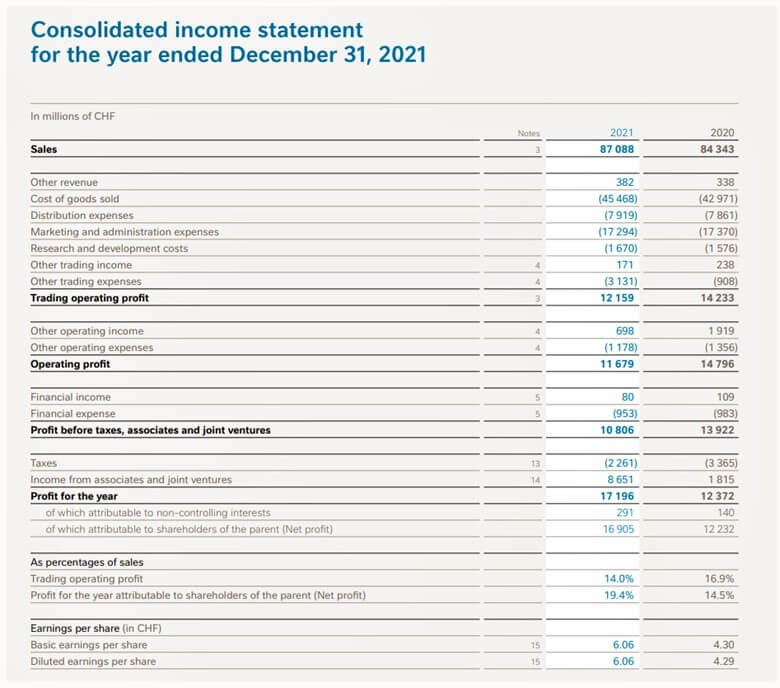
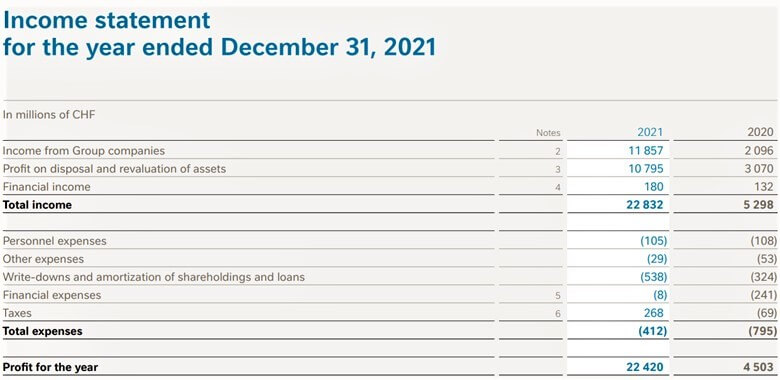
Let’s implement the income statement formulas and do the required calculations for Nestle for the FY ending December 31, 2021.
(Source: Annual Report of Nestle for the FY21)
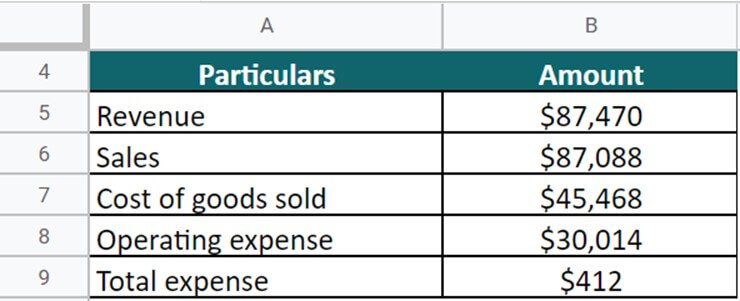
For FY21, Nestle has provided the below data:
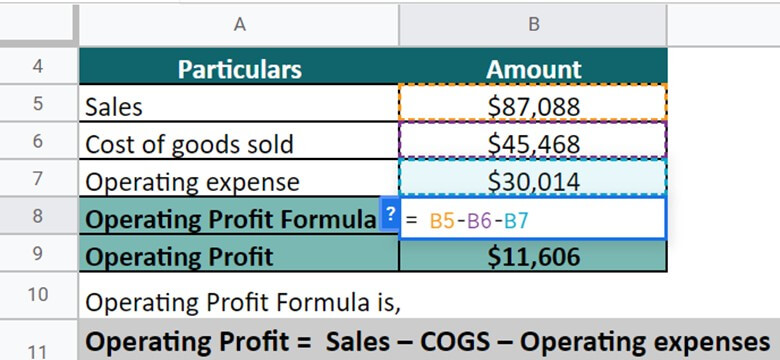
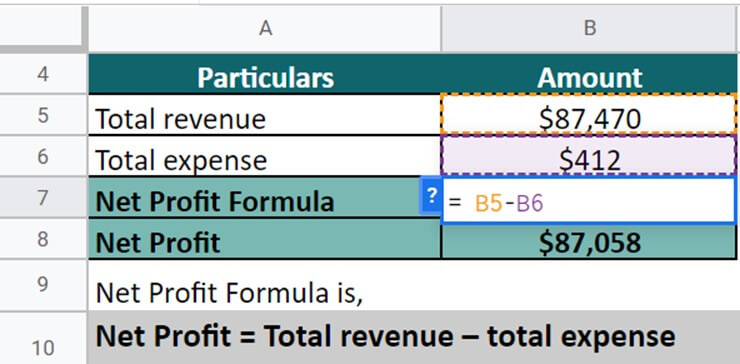
- Total revenue = Sales + Other revenues = $87,088 + $382 = $87,470
- Sales = $87,088
- COGS = $45,468
- Operating expense = Distribution expenses + Marketing and administration expenses + Research and development costs
= $7,919 + $17,294 + $1,670 + $3,131 + $1,178 = $30,014 - Total expense = $412
Let’s implement the various income statement formulas and do the calculations for Nestle.
Given,
Let’s implement the income statement formulas and find the values:
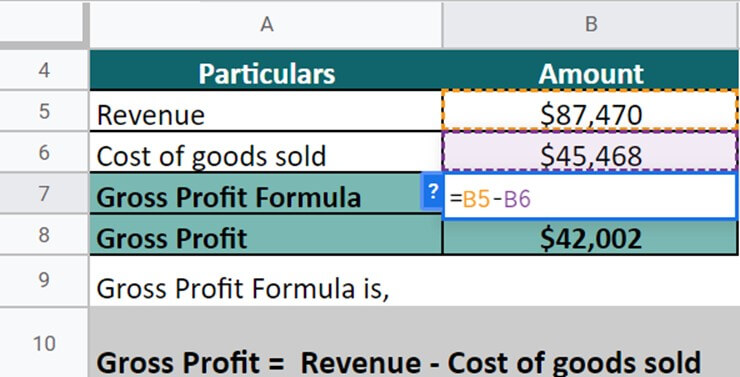
Formula #1: Gross Profit = Revenue – Cost of Goods Sales (COGS)
Given,
Solution: For the calculation of gross profit, we have implemented the below formula:
Here, Gross Profit = Revenue – Cost of goods sold
= $87,470 – $45,468
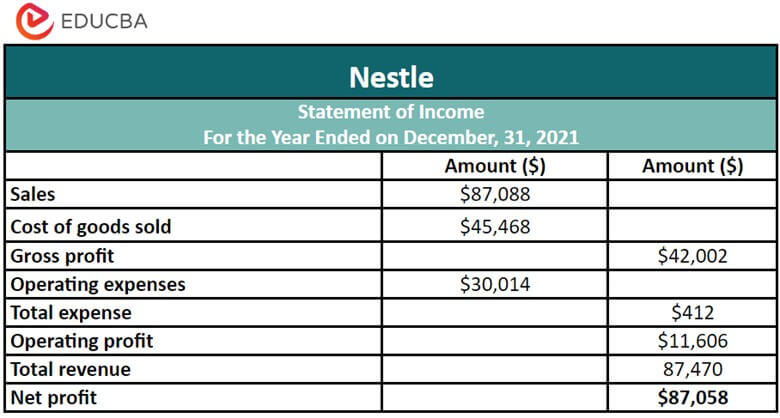
= $42,002
Thus, Nestle enlists a gross profit of $42,002 for FY21.
Formula #2: Operating profit = Sales – COGS – Operating expenses
Given,
Solution: After finding the gross profit, we have to find the operating profit for Nestle:
Here, Operating profit = Sales – Cost of goods sold – Operating expense
= $87,088 – $45,468 – $30,014
= $11,606
Therefore, the operating profit made by Nestle is $11,606.
Formula #3: Net Profit = Total revenue – Total expense
Given,
Solution: When calculating the net profit, we have to use the below formula:
Here, Net profit = Total revenue – total expense
= $87,470- $412
= $87,058
Thus, for FY21, Nestle made a net profit of $87,058.
So, now we have all the crucial metrics derived from the income statement formulas. Now, we have to put them in an income statement given below:
Example #2
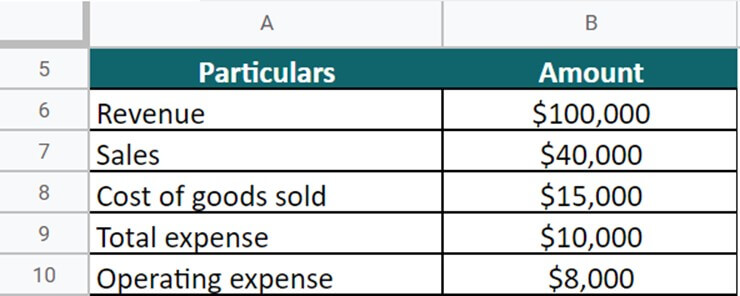
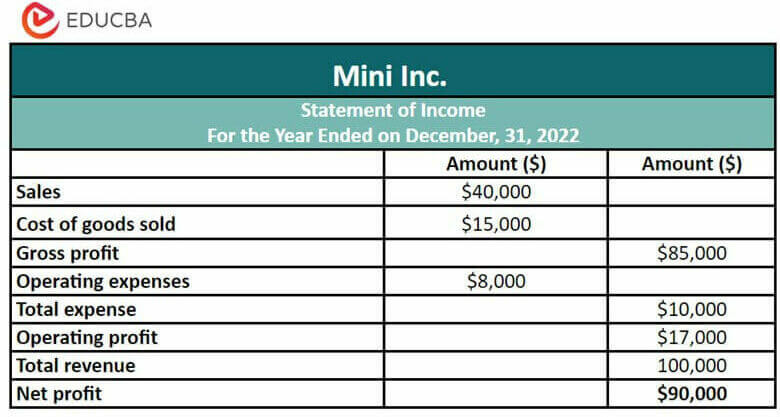
Mini Inc. is a company that has enlisted the following data in its balance sheet for FY22:
- Total revenue = $100,000
- Sales = $40,000
- COGS = $15,000
- Total expense = $10,000
- Operating expense = $8,000
Use the income statement formulas and derive relevant calculations.
Given,
Now, we will implement all three income statement formulas to do the calculations:
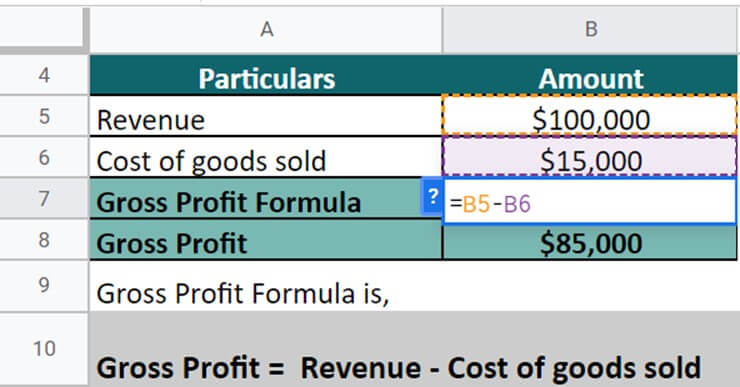
Formula #1: Gross Profit = Revenue – Cost of Goods Sales (COGS)
Given,
Solution: Implementing the formula, let’s calculate the gross profit;
Here, Gross Profit = Revenue – Cost of goods sold
= $100,000 – $15,000
= $85,000
Therefore, the gross profit generated by the company is $85,000.
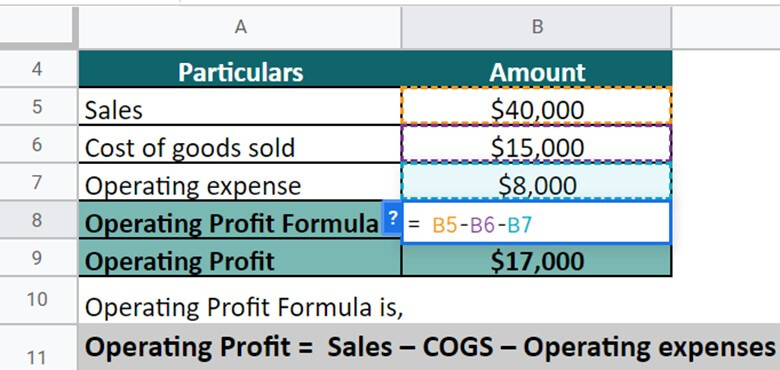
Formula #2: Operating profit = Sales – COGS – Operating expenses
Given,
Solution: To find the operating profit, we have to implement the below formula;
Here, Operating profit = Sales – Cost of goods sold – Operating expense
= $40,000 – $15,000 – $8,000
= $17,000
Thus, the operating profit that the company gains is $17,000.
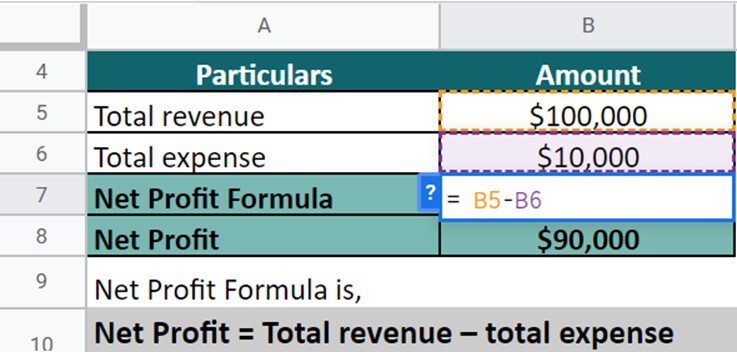
Formula #3: Net Profit = Total revenue – Total expense
Given,
Solution: For calculating the net profit, we have to use the below formula;
Here, Net profit = Total revenue – total expense
= $100,000 – $10,000
= $90,000
So, the net profit made by the company for the particular financial year is $90,000.
After deriving all the formulas, we look at the final income statement for Mini Inc. for FY22.
Example #3
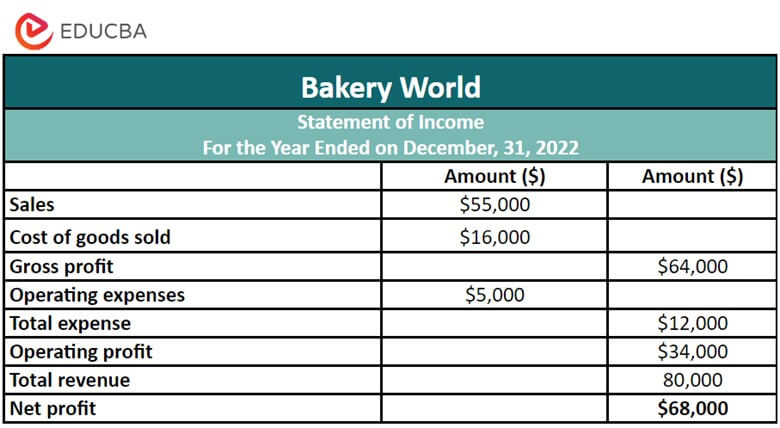
The Bakery World is a business based in the UK, specializing in bakery products. It’s the end of FY22, and the company has provided the below data to make its income sheet.
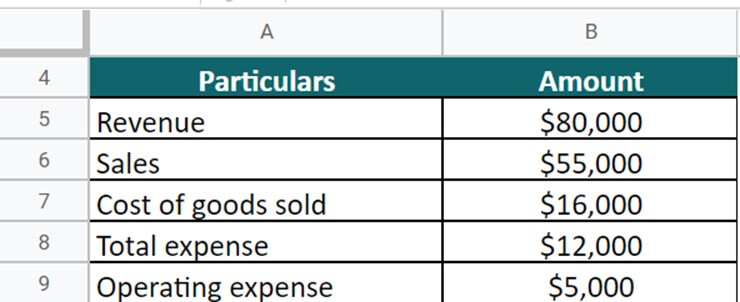
- Total revenue = $80,000
- Sales = $55,000
- COGS = $16,000
- Total expense = $12,000
- Operating expense = $5,000
Use the various income statement formula and help Bakery World create its income sheet.
Given,
To do the calculations, we have to implement the income statement formula:
Formula #1: Gross Profit = Revenue – Cost of Goods Sales (COGS)
Given,
Solution: To calculate the gross profit, we have to implement the below formula:
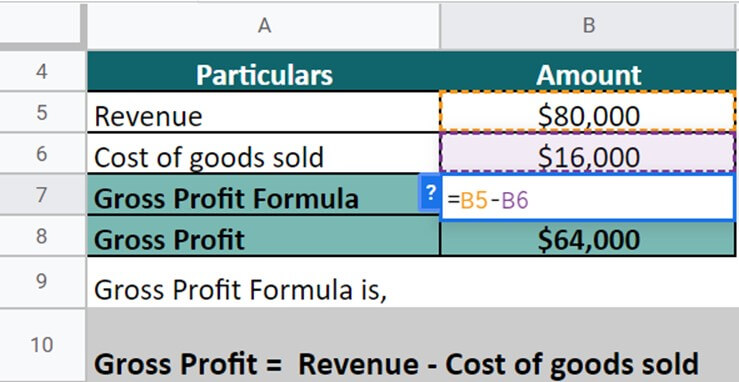
Here, Gross Profit = Revenue – Cost of goods sold
= $80,000 – $16,000
= $64,000
Thus, Bakery World made a gross profit of $64,000 for FY22.
Formula #2: Operating profit = Sales – COGS – Operating expenses
Given,
Solution: Now, we have to find the operating profit for Bakery World:
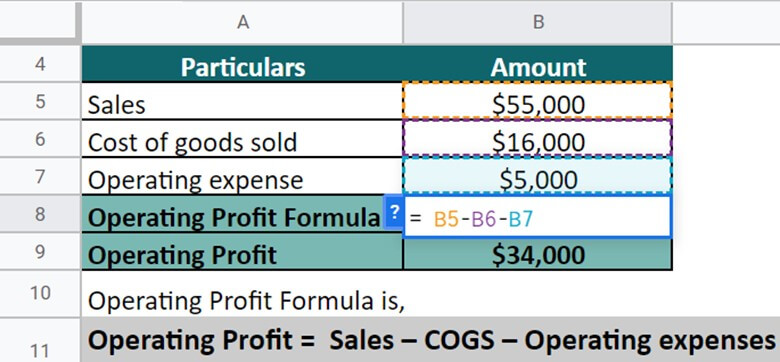
Here, Operating profit = Sales – Cost of goods sold – Operating expense
= $55,000 – $16,000 – $5,000
= $34,000
Thus, Bakery World made an operating profit of $34,000.
Formula #3: Net Profit = Total revenue – Total expense
Given,
Solution: When calculating the net profit, we have to use the below formula:
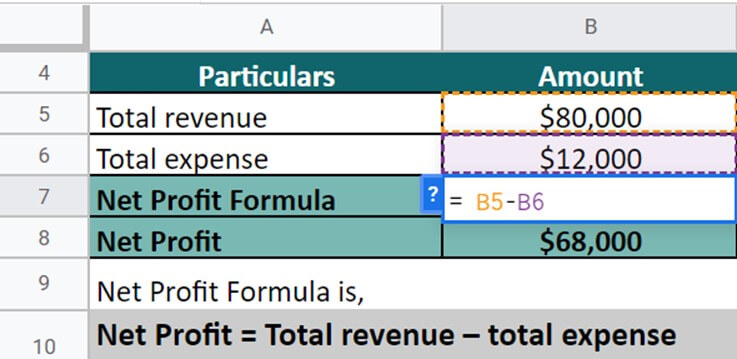
Here, Net profit = Total revenue – total expense
= $80,000 – $12,000
= $68,000
So, the net profit made by Bakery World for FY22 is $90,000.
We have found the essential metrics for the income statement, and it’s time to put the values and prepare the final income statement. Below is the income statement of Bakery World for FY22.
Things to Remember
- We cannot compare ratios and metrics universally between companies in different industries due to their unique operating conditions. For example, the interpretation of a high net profit margin varies between tech and retail companies.
- Seasonality is essential when analyzing a company’s financial performance. Industries like retail or hospitality may see changes in revenue and profits depending on the time of year. It’s necessary to take these seasonal fluctuations into account.
- A lower net profit margin isn’t always negative. For example, a growing company may have a negative profit margin because it’s investing heavily in expanding and gaining market share. This negative profit margin could be a positive sign of the company’s growth potential.
- Gross profit margin analysis is essential, but firms should also consider other factors such as operating expenses and net income margin. A company with a high gross margin may have high operating expenses that decrease its profits, resulting in a lower net income margin.
Relevance and Uses of Income Statement Formula
- Analyzing income statement formulas is crucial for anyone looking to understand a company’s financial performance. Investors, portfolio managers, and other interested individuals can quickly analyze the income statement and use the formulas to make informed decisions.
- Income statement ratios provide a benchmark for small businesses to compare their financials and identify areas for improvement. Companies can analyze their ratios and compare them to industry benchmarks to decide how to improve their operations and financial performance.
- For instance, if a business has a higher gross margin than the benchmark but a lower net profit margin, its operational costs are higher than the benchmark. In such cases, the business can take essential steps to reduce operating costs and improve its net profit margin.
Frequently Asked Questions (FAQs)
Q1. What is an income statement loss example?
Answer: Companies can experience a loss in their income statement due to either non-operating or operating activities. Non-operating losses come from selling assets at a loss, writing down assets, or losing lawsuits. Operating losses happen when a company sells its products or services for less than its cost of production.
Q2. What is the comparative income statement format?
Answer: Companies may have income statement losses from non-operating or operating activities when assets or products are sold below book value or production cost. Non-operating losses result from selling assets at a loss, writing down assets, or losing lawsuits. Operating losses occur when selling products or services below production cost.
| Year 1 | Year 2 | |
| Revenue | $100,000 | $120,000 |
| Cost of Goods Sold | $60,000 | $70,000 |
| Gross Profit | $40,000 | $50,000 |
| Operating Expenses | $25,000 | $30,000 |
| Net Income | $15,000 | $20,000 |
Q3. What do we include in an income statement?
Answer: An income statement reports revenue, expenses, gross profit, operating profit, and net profit for a specific period. It also includes metrics like EPS, depreciation, amortization, interest expenses, and taxes paid.
Q4. What is the income statement formula for variable costing?
Answer: The income statement formula for variable costing subtracts all variable costs from revenue to get the contribution margin. Then, we must subtract all fixed costs from the contribution margin to calculate the net profit or loss.
For example, let’s say a company sells 10,000 smartphones for $500 each with a variable cost of $200 per smartphone and has $100,000 in fixed costs.
The formula would be:
Contribution margin = ($500 x 10,000) – ($200 x 10,000) = $3,000,000
Net profit or loss = $3,000,000 – $100,000 = $2,900,000
Therefore, the company would report a net profit of $2,900,000 using the variable costing income statement formula.
Recommended Articles
This is a guide to the Income Statement formula. Here we discuss How to Calculate Income Statements, practical examples, and downloadable Excel templates. You may also look at the following articles to learn more–
