Updated July 27, 2023
Inventory Formula (Table of Contents)
Inventory Formula
Inventory, in very simple terms, is basically products, goods, raw material which are not utilized by the business and expected to be used. So basically, businesses produce goods to sell in the market and the products which are still lying with the business is part of the inventory.
Inventory is part of a company’s balance sheet and in categorized under current assets. The reason is that it is expected that it will be sold in the coming months. Inventory can be finished goods, Work in process goods or raw material. In order to make ensure inventory records are accurate and up to date, businesses usually take an inventory count at the end of each quarter or year. Any difference between the counted inventory and inventory on a balance sheet is called “shrinkage”. This happens because of various reasons like inventory lost, stolen inventory, etc.
Inventory value has much significance and it needs to be monitored closely. If company has too much of inventory, it means that the company is not able to sell the products and it can result in cash flow problems and eventual losses because inventory will become obsolete. On the other hand if it is very less, it means that business is not able to cope up the demand and it can result in loss of clients and businesses. Another key point to keep in mind is that Inventory is reported at the its cost and not at its selling price.
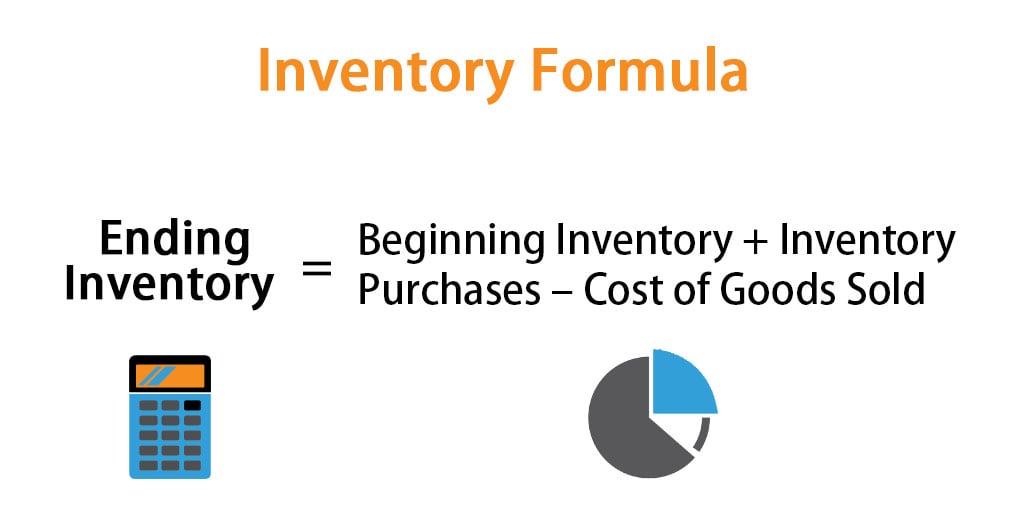
Although inventory is part of the company’s balance sheet, change in inventory is calculated with the help of Cost of goods sold which is part of the company’s income statement. The formula for change in inventory is given by:
or
So to calculate ending inventory for the period, we will start will the inventory which is currently listed on company’s balance sheet. Add the new purchases and subtract the Cost of goods sold
Methods For Calculating Ending Inventory
There are 3 different ways of calculating ending inventory:
- FIFO (First IN First OUT) Method: In this method, items which are purchased first will be sold first and the remaining items will be the latest purchases. So if the market environment is inflationary, ending inventory value will be higher since items which are purchased at a higher price are part of ending inventory
- LIFO (Last IN First OUT) Method: In this method, items which are purchased last will be sold first and the remaining items will be the old purchases. So if the market environment is inflationary, ending inventory value will be lower since items which are purchased at a lower price are part of ending inventory
- Weighted Average Cost Method: In this method, the average cost per unit is calculated by dividing the total value of inventory by the total number of units available for sale. Ending Inventory is then calculated by the average cost per unit by the number of units available at the end of the period.
Examples of Inventory Formula (With Excel Template)
Let’s take an example to understand the calculation of Inventory in a better manner.
Inventory Formula – Example #1
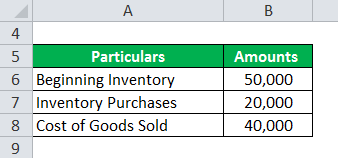
Let say company A has an opening inventory balance of 50,000 for the month of July. During the remaining financial year, the company has made purchases amounting 20,000 and during that time, on the company’s income statement, the cost of goods sold is 40,000. Below is the data table:
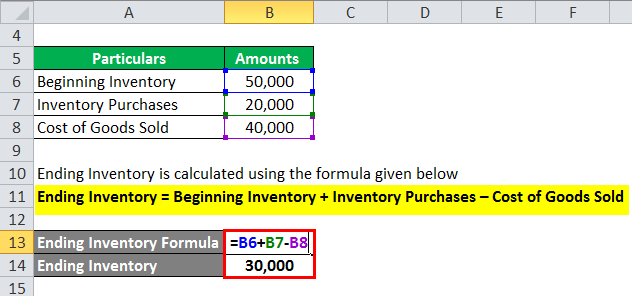
Ending Inventory is calculated using the formula given below
Ending Inventory = Beginning Inventory + Inventory Purchases – Cost of Goods Sold
- Ending inventory = 50,000 + 20,000 – 40,000
- Ending inventory = 30,000
Inventory Formula – Example #2
Now let see another example to find ending inventory using FIFO, LIFO and Weighted average method. Let only take the inflationary environment in the picture to understand all three methods
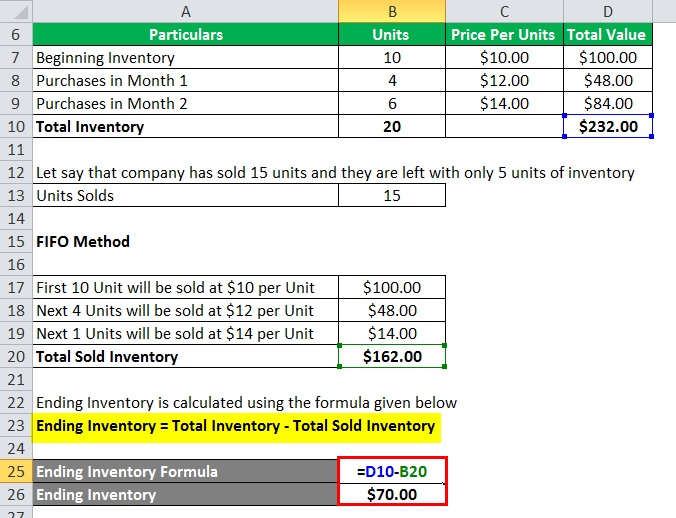
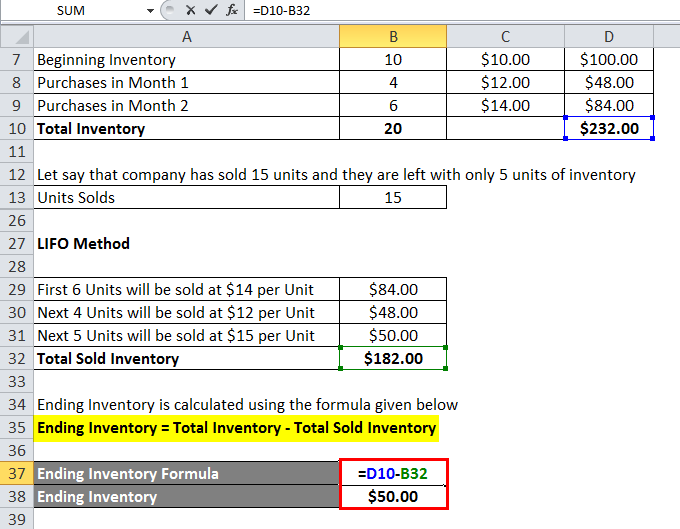
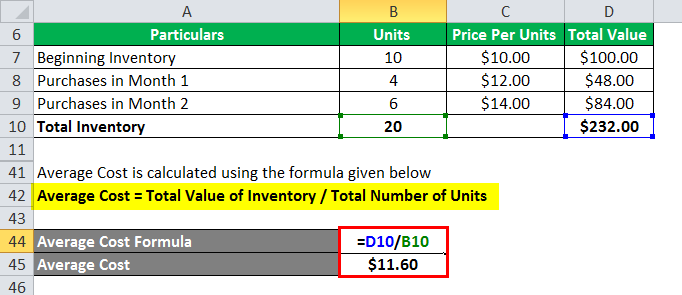
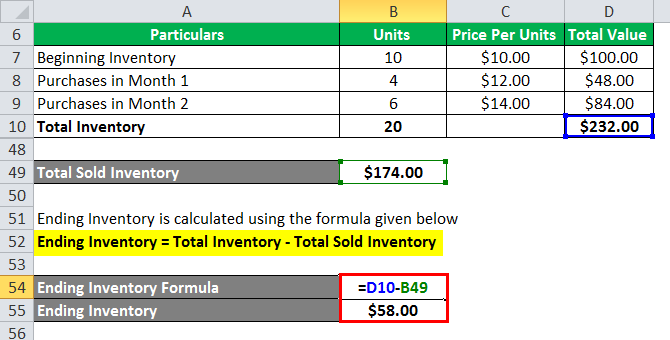
Let say a company XYZ has beginning inventory of 10 unit with a unit price of $10 per unit. The market environment is inflationary which means that prices of the unit are increasing in the market. Company has made a few purchases in month 1 and 2 in this inflationary environment. Below is the data table:
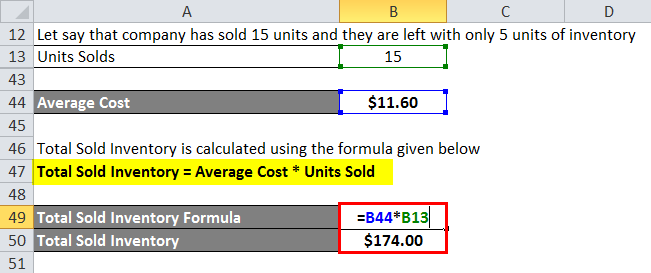
Let say that the company has sold 15 units and they are left with only 5 units of inventory
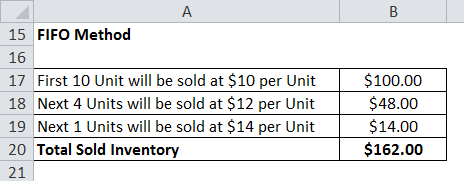
1. FIFO Method
Ending Inventory is calculated using the formula given below
Ending Inventory = Total Inventory – Total Sold Inventory
- Ending Inventory = $232 – $162
- Ending Inventory = $70
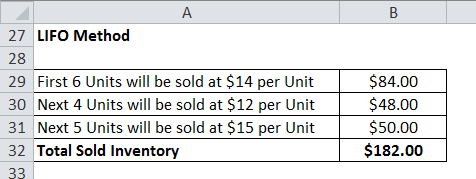
2. LIFO Method
Ending Inventory is calculated using the formula given below
Ending Inventory = Total Inventory – Total Sold Inventory
- Ending Inventory = $232 – $182
- Ending Inventory = $50
3. Weighted Average Cost Method
Average Cost is calculated using the formula given below
Average Cost = Total Value of Inventory / Total Number of Units
- Average Cost = $232 / 20
- Average Cost = $11.60
Total Sold Inventory is calculated using the formula given below
Total Sold Inventory = Average Cost * Units Sold
- Total Sold Inventory = $11.60 * 15
- Total Sold Inventory = $174
Ending Inventory is calculated using the formula given below
Ending Inventory = Total Inventory – Total Sold Inventory
- Ending Inventory = $232 – $174
- Ending Inventory = $58
Explanation of Inventory
Like it is explained above, inventory change is basically the difference between ending and beginning period inventory. This is very useful to check how well the business in managing its inventory. It is also used for budgeting and to determine future working capital requirements. Usually, inventory change is calculated on a monthly or quarterly basis. There are several reasons why inventory change is calculated:
- From the formula above, we can see that we can use the change in inventory to find out what is the COGS for that particular period.
- It is also used for better inventory management. The concerned inventory team analyze the change in inventory on each type i.e raw material, WIP and finished products and take necessary actions to manage it properly
- Similarly, it is also helpful in budgeting. The budgeting team analyzes the change in inventory and estimates what cash will be required for inventory for the future. So if inventory is reducing, it means products are selling so less cash has required an increase in inventory means we need more cash
Relevance and Uses of Inventory Formula
Inventory is one of the main driver various aspects of financial statement and analysis. A ratio like inventory turnover etc. help us to analyze the health of the business. Any sudden change in inventory can send a negative signal to investors which can impact business profitability. That is the reason that companies spend a good amount of time to calculate the optimum level of inventory for them. Inventory levels are not the same for every company and different companies operating in different industries have a different level of inventory requirements. But businesses should keep a close eye its inventory.
Inventory Formula Calculator
You can use the following Inventory Calculator
| Beginning Inventory | |
| Inventory Purchases | |
| Cost of Goods Sold | |
| Ending Inventory | |
| Ending Inventory = | Beginning Inventory + Inventory Purchases - Cost of Goods Sold | |
| 0 + 0 - 0 = | 0 |
Recommended Articles
This has been a guide to Inventory Formula. Here we discuss how to calculate Inventory Formula along with practical examples. We also provide an Inventory Formula calculator with downloadable excel template. You may also look at the following articles to learn more –
