Updated July 17, 2023
What is an Inverted Yield Curve?
The term “inverted yield curve” refers to the situation wherein the short-term debt instruments generate a higher yield than the long-term debt instruments of the same credit quality, which is opposite to what happens in the normal scenario. It is considered the leading indicator of an economic recession, as statistics show that a recession invariably follows an inverted yield curve. It is also popularly known as the negative yield curve.
Explanation
The yield curve graphically represents the yields of similar bonds across different maturity periods. It is also referred to as the term structure of interest rates. Normally, a yield curve is upward-sloping, which indicates that the long-term interest rates are higher than the short-term interest rates.
The normal yield curve reflects the fact that investors usually consider long-term investments risky and so charge liquidity premium for that resulting in higher yield. However, at times investment sentiments change, and investors tend to prefer long-term instruments over short-term investments, which indicates an economic recession in the near term. This is when the yield curve inverts and the long-term interest rates become lower than the short-term interest rates.
Examples of Inverted Yield Curve
There have been several instances of inversion of the yield curve prior to the inception of an economic recession. Here, we will briefly discuss some instances in the last two decades.
- In 1998, a brief inversion of the yield curve continued for a few weeks, during which the Treasury bond prices surged. The Fed then quickly intervened with some interest rate cuts to prevent a recession in the US. However, it is believed that the Fed’s actions may have catapulted the subsequent dotcom bubble in 2000.
- In 2006, the yield curve witnessed another inversion for most of the year. In fact, the long-term Treasury bonds outperformed the stocks in 2007 and soared in 2008 as the stock market plummeted. It marked the onset of the Great Recession of 2008.
- In 2019, there was another brief inversion of the yield curve. Subsequently, signs of inflationary pressure due to a tight labor market coupled with a series of interest rate hikes by the Fed raised apprehensions of a recession, forcing the Fed to return on its plan to increase interest rates. However, many experts believe it signaled the onset of the economic crisis of 2020, in which the outbreak of COVID-19 has further worsened.
Why Does the Yield Curve Invert?
Inherently, debt investors are very reactive to changes in interest rates and government policies. While short-term bonds are more sensitive to changes in interest rates than long-term bonds, long-term bonds are more reactive to inflationary economic expectations than short-term bonds.
Therefore, several rate cuts in a short span of time result in growing concerns in the market as investor confidence drops. People tend to go for more secure long-term investments resulting in increased price (or reduced yield), while they avoid short-term investments pushing their yield high. In this way, the yield of the long-term bonds drops below that of the short-term bonds leading to an inverted yield curve.
Causes of the Inverted Yield Curve
As can be seen from the previous section, the primary causes of an inverted yield curve are:
- Frequent changes in interest rates
- The expectation of stability in the long run
- Weakening economy
- Low market confidence
Interest Rates
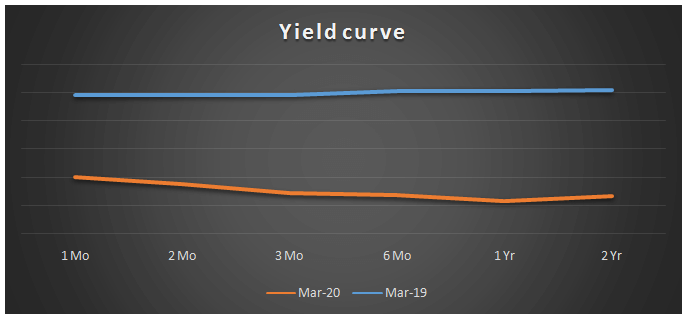
The bond yield in the US saw a major decline since July 2019, which further worsened with the outbreak of COVID-19, resulting in weak investor sentiments. As such, we saw an inversion of the yield curve during March 2020 (as seen in the below graph) as people expected severe impacts of the ongoing pandemic in the near term. In a declining interest rate scenario, investors started to resort to long-term Treasury bonds; hence the yield curve inverted. The below graph shows that the blue yield is from March 2019 and is a normal yield curve, while the orange one is from March 2020 and represents an inverted yield curve. However, the good news is that the scenario has improved since then.
Source: Treasury.gov
| Date | 1 Mo | 2 Mo | 3 Mo | 6 Mo | 1 Yr | 2 Yr |
| 4-Mar-19 | 2.45% | 2.46% | 2.46% | 2.54% | 2.54% | 2.55% |
| 4-Mar-20 | 1.00% | 0.87% | 0.72% | 0.68% | 0.59% | 0.67% |
How Does an Inverted Yield Curve Predict Recession?
Historically, most of the inversions in the yield curve in the US have been followed by a recession. As such, the inversion in the yield curve is seen as a leading indicator to predict the turning point in the business cycle. An inverted yield curve indicates that most investors believe the economy is weakening and is about to go into recession. Consequently, they are attracted to stable long-term treasury bonds as a safe haven for parking their money in a crashing stock market environment. Given the high demand for long-term bonds, their yield begins to drop, resulting in an inverted curve.
Impact of Inverted Yield Curve
Some of the major impacts of the inverted yield curve are as follows:
- It almost entirely wipes out the risk premium from long-term investments.
- The spread between treasury bonds and other corporate bonds narrows down.
- The profit margins for banks and companies decline significantly.
- Investment in essential commodities increases as they are least expected to be impacted by the recession.
Recommended Articles
This is a guide to Inverted Yield Curve. Here we discuss the introduction and causes of the inverted yield curve, along with impacts and examples. You may also have a look at the following articles to learn more –


