Updated March 21, 2023
Introduction to JavaFX Pie Chart
Data can be represented in several ways. One of the most common among them is by using charts. Charts are of different types such as Pie charts, line charts, scatter charts, etc. In the case of Pie chart, data will be denoted in the form of a circle separated into slices. For a better understanding, we can also say that each and every slice combine together to form a whole circle. The pie chart can be instantiated from the class javafx.scene.chart.PieChart. Let us look into the JavaFX Pie chart in detail.
A pie chart can be created using the below syntax.
Syntax:
ObservableList<PieChart.Data> pcd = FXCollections.observableArrayList(
new PieChart.Data("Lucky",50),
new PieChart.Data("Unlucky",50),
);
PieChart pc = new PieChart(pcd);
Errors can occur if the class javafx.scene.chart.PieChart is not imported into the program.
Constructors of JavaFX Pie Chart
There are two constructors for the JavaFX Pie chart. They are:
- PieChart(): A new empty PieChart will be created.
- PieChart(ObservableList< PieChart.Data> D): A new PieChart will be created with the specified data.
Methods of JavaFX Pie Chart
Here are important methods are given below:
- getData(): Data property’s value will be returned.
- setData(ObservableList< PieChart.Data> v): Data property’s value will be set as v.
- getLabelLineLength(): labelLineLength property’s value will be returned.
- setLabelLineLength(double v): LabelLineLength property’s value will be set as v.
- getLabelsVisible(): Specifies whether labels of slices in the pie chart are drawn or not.
- setLabelsVisible(boolean v): LabelsVisible property’s value will be set as v.
- getStartAngle(): StartAngle property’s value will be returned.
- setStartAngle(boolean v): StartAngle property’s value will be set as v.
- isClockwise(): Clockwise property’s value will be returned.
- setClockwise(boolean v): Clockwise property’s value will be set as v.
How to Create a JavaFX Pie Chart?
In order to create it, the below steps can be performed.
Step 1: Create a class that extends from the application class.
Code:
public class JavaFXChartsExample extends Application {
}
Step 2: Create the observablelist object so that data that has to be added in the pie chart will be passed in the observable list.
Code:
ObservableList<PieChart.Data> pcd = FXCollections.observableArrayList(
new PieChart.Data("Lucky",50),
new PieChart.Data("Unlucky", 50),
);
Step 3: Create the pie chart object or instantiate the class for the pie chart. Then, the following syntax can be used for PieChart object creation.
Code:
PieChart p = new PieChart(pcd);Step 4: Set title for the created pie chart. The pie chart can be named by using the settitle() method as depicted below.
Code:
//Set title of the chart
pc.setTitle("Emotions of humans");
Step 5: Set direction, label length, and visibility. Once the pie chart is created, set the direction as clockwise or anti-clockwise. After that, set the length of the label line by using the setLabelLineLength() method. Then, set the visibility as true.
Code:
//direction
pc.setClockwise(true);
//label line length
pc.setLabelLineLength(45);
//visibility of labels
pc.setLabelsVisible(true);
Step 6: Configure group and scene. Next, a group and scene will be created. The scene is created by instantiating the class javafx.scene once the group is created. Then only the group can be passed as one of the arguments in the scene.
Code:
//Group object creation
Group r = new Group(pc);
//scene object creation
Scene s = new Scene(r, 600, 400);
//set title
stage.setTitle("Pie chart");
//Add scene
stage.setScene(s);
//Displaying the results
stage.show();
Examples to Implement JavaFX Pie Chart
Now, let us see different JavaFX examples to implement Pie chart.
Example #1
Program to demonstrate Pie chart with an observable list.
Code:
import javafx.application.Application;
import javafx.collections.FXCollections;
import javafx.collections.ObservableList;
import javafx.scene.Group;
import javafx.scene.Scene;
import javafx.stage.Stage;
import javafx.scene.chart.PieChart;
//class that extends application class
public class JavaFXPieChartExample extends Application {
//application starting point
@Override
public void start(Stage s) {
//object of the ObservbleList with each slice percentage
ObservableList<PieChart.Data> pcd = FXCollections.observableArrayList(
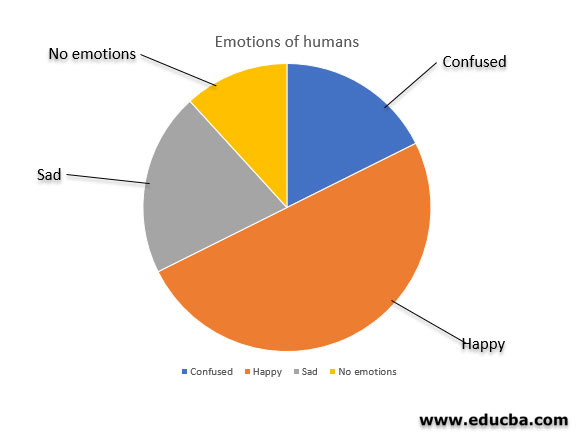
new PieChart.Data("Happy",50),
new PieChart.Data("Sad", 25),
new PieChart.Data("No emotions", 10),
new PieChart.Data("Confused", 15));
//piechart creation
PieChart pc = new PieChart(pcd);
//Set title of the chart
pc.setTitle("Emotions of humans");
//direction of the created piechart
pc.setClockwise(true);
//length of the label lines in piechart
pc.setLabelLineLength(45);
//visibility of labels in the chart
pc.setLabelsVisible(true);
//start angle that has to be used in chart
pc.setStartAngle(180);
//Group object creation
Group r = new Group(pc);
//scene object creation
Scene sc = new Scene(r, 600, 400);
//set title for the stage
s.setTitle("Pie chart");
//Add scene
s.setScene(sc);
//Displaying the results
s.show();
}
public static void main(String args[]){
launch(args);
}
}
Output:
Example #2
Program to demonstrate Pie chart with an observable list.
Code:
import javafx.application.Application;
import javafx.geometry.Side;
import javafx.scene.Group;
import javafx.scene.Scene;
import javafx.stage.Stage;
import javafx.scene.chart.PieChart;
//class that extends application class
public class JavaFXPieChartExample extends Application {
//application starting point
@Override
public void start(Stage s) {
//piechart creation
PieChart pc = new PieChart();
//add slice1 of the chart
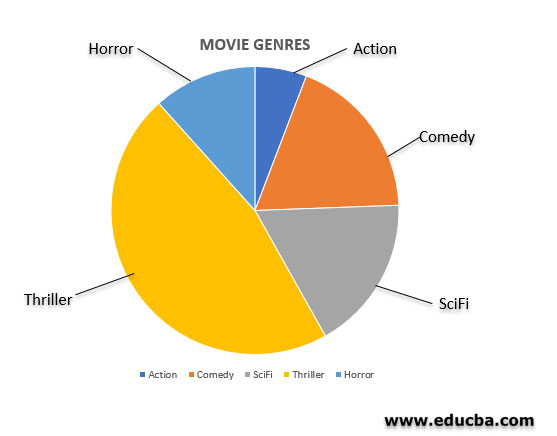
PieChart.Data s1 = new PieChart.Data("Comedy", 20);
//add slice2 of the chart
PieChart.Data s2 = new PieChart.Data("Thriller", 40);
//add slice3 of the chart
PieChart.Data s3 = new PieChart.Data("Horror", 20);
//add slice4 of the chart
PieChart.Data s4 = new PieChart.Data("SciFi", 15);
//add slice5 of the chart
PieChart.Data s5 = new PieChart.Data("Action", 5);
pc.getData().add(s1);
pc.getData().add(s2);
pc.getData().add(s3);
pc.getData().add(s4);
pc.getData().add(s5);
//location to display the legend
pc.setLegendSide(Side.RIGHT);
//Set title of the chart
pc.setTitle("MOVIE GENRES");
//direction of the created piechart
pc.setClockwise(true);
//length of the label lines in piechart
pc.setLabelLineLength(45);
//visibility of labels in the chart
pc.setLabelsVisible(true);
//start angle that has to be used in chart
pc.setStartAngle(180);
//Group object creation
Group r = new Group(pc);
//scene object creation
Scene sc = new Scene(r, 600, 400);
//set title for the stage
s.setTitle("Pie chart");
//Add scene
s.setScene(sc);
//Displaying the results
s.show();
}
public static void main(String args[]){
launch(args);
}
}
Output:
In this output, a pie chart is created with 4 slices of different proporti
ons. Here, Legend is at the bottom of the pie chart and the title is at the top of the chart. The main difference of this program is the absence of using an observable list in order to set the slices. Also, Legend is customized to display at the right of the pie chart.
Conclusion
Charts are well known for representing data. The pie chart is one such chart in which a whole circle is divided into slices based on the proportion.
Recommended Articles
This is a guide to JavaFX Pie Chart. Here we discuss syntax, constructors, methods and how to create a JavaFX Pie chart along with its examples and implementation. You may also look at the following articles to learn more –


