Updated June 7, 2023

Introduction to JavaScript Debugging
Finding out the coding errors in each project step by step with any tools or keywords is known as Debugging. When we are writing any new programming language code, there may be a possibility to encounter errors. These errors may be belonging to syntactical errors or logical errors. It is difficult to figure out where we got the errors because we may have lakhs of lines of code. Is it easy to figure out the error from 1 lakh lines by looking at the code directly? No right. So, to tackle this kind of situation, we have a feature debugging in JavaScript.
How Debugging works in JavaScript?
In JavaScript debugging can be done in two ways:
1. Debugger Keyword
- The debugger keyword is used for browsers like Firefox, Chrome, Opera, Bingo, Internet Explorer, Microsoft Edge, etc.
- As per the functionality issue keep the debugger keyword in that function and debug the code.
- While running the code, before executing the entire code, the JavaScript compiler pauses the execution at the debugger keyword.
- After pausing the code, from there we can analyze the code step by step to find out the actual error.
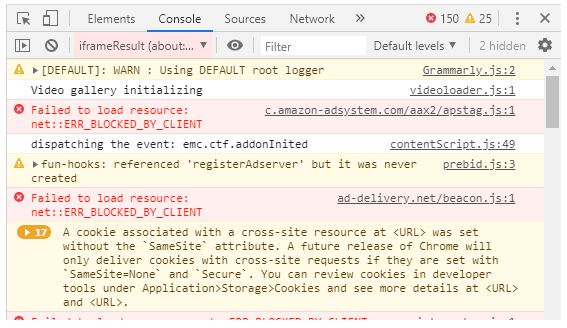
Console tab for error inspection
Syntax:
var variableName=value;
debugger; //declaring debugger keyword
for(let i=0;i<=10;i++) // some logic
{
//application code
}
Debugger Mode:
- After using the debugger keyword in our application then press the F12 button and executing the code then we are getting debugger mode as in the above image.
- Paused in debugger right side blue color button is used to Resume (start the process again) the code. Shortcut key is F8.
- On the right side of the blue button is a black color button. It is used for moving the cursor line by line to find out the bug or error. Short cut key is
2. IDE Breakpoints
- Breakpoints are used in IDEs like eclipse, Net Beans, and Visual Studio instead of debugger keywords.
- As per error prediction functionality there we should keep breakpoint.
- Instead of running all the applications at a time, breakpoint makes the code run between breaking points only, it saves time by ignoring non-error lines.
- With the help of IDE’s breakpoints, we can analyze the error in the application.
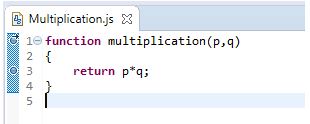
Breakpoint in eclipse IDE:
- In the above image line, 1 and 3 are having breakpoints.
Examples of Javascript Debugging
Given below are the examples of JavaScript Debugging:
Example #1
Armstrong Number by using debuggerCode.
Code:
<!DOCTYPE html>
<html>
<body>
<font color="red"><h1 align="center">Armstrong Number with Debugger</h1></font>
<script>
function armstrongNumberOrNot() {
document.write("Armstrong numbers between 100 to 500 are =><br>");
for (var p = 1; p < 10; ++p) {
for (var q = 0; q < 10; ++q) {
for (var r = 0; r< 10; ++r) {
debugger; //declaring debugger
var armstrongPower = (Math.pow(p, 3) + Math.pow(q, 3) + Math.pow(r, 3));//armstrong logic
var adding = (p * 100 + q * 10 + r);//adding the numbers for sum
if (armstrongPower == adding) {
document.write(armstrongPower+"<br>");
console.log(armstrongPower);
}
}
}
}
}
armstrongNumberOrNot();
</script>
</body>
</html>
Output:
Explanation:
When we press F12 and run the code then the code becomes moved into debugger mode as above.
Example #2
Prime number by using the debugger.
Code:
<!DOCTYPE html>
<html>
<body>
<font color="brown"><h1 align="center">Prime Number with Debugger</h1></font>
<script>
function primeNumberOrNot() {
var number=7, temp = true;
for(var p = 2; p <= number - 1; p++)
if (number % p == 0) { //check prime or not
temp = false;
break;
}
//checking the number is prime or not
if (temp == true)
document.write(number + " is  PRIME number");
else
document.write(number + " is NOT PRIME number");
}
primeNumberOrNot();
</script>
</body>
</html>
Output:
Explanation:
When we press F12 and run the code then the code becomes moved into debugger mode as above.
Example #3
Fibonacci Series by using a debugger.
Code:
<!DOCTYPE html>
<html>
<body>
<font color="orange"><h1 align="center">Fibonacci Series with Debugger</h1></font>
<script>
var fibonacciNumbers = function (number)
{
if (number===1)
{
return [0, 1];
}
else
{
var series = fibonacciNumbers(number - 1);
debugger;
series.push(series[series.length - 1] + series[series.length - 2]);
return series;
}
};
var fibSeries=fibonacciNumbers(8);
document.write("Fibonacci series=>")
document.write(fibSeries);
</script>
</body>
</html>
Output:
Explanation:
When we press F12 and run the code then the code becomes moved into debugger mode as above.
Example #4
Reversing String by using the debugger.
Code:
<!DOCTYPE html>
<html>
<body>
<font color="violet"><h1 align="center">Reverse String with Debugger</h1></font>
<script>
function reverseString(stringValue){
var reverse = "";
for(var p = stringValue.length - 1; p >= 0; p--)
{
debugger;
reverse=reverse+ stringValue.charAt(p);
}
return reverse;
}
var myString="Amardeep";
var reverseString=reverseString(myString);
document.write("Reverse of "+myString+" is "+reverseString);
</script>
</body>
</html>
Output:
Explanation:
When we press F12 and run the code then the code becomes moved into debugger mode as above.
Conclusion
Debugging in JavaScript can be done by using debugger keyword. Debugger is used to debug the necessary code by keeping debugger keyword at a particular point.
Recommended Articles
This is a guide to JavaScript Debugging. Here we discuss the introduction, how debugging works in JavaScript? and examples. You may also have a look at the following articles to learn more –


